Fig. 2.
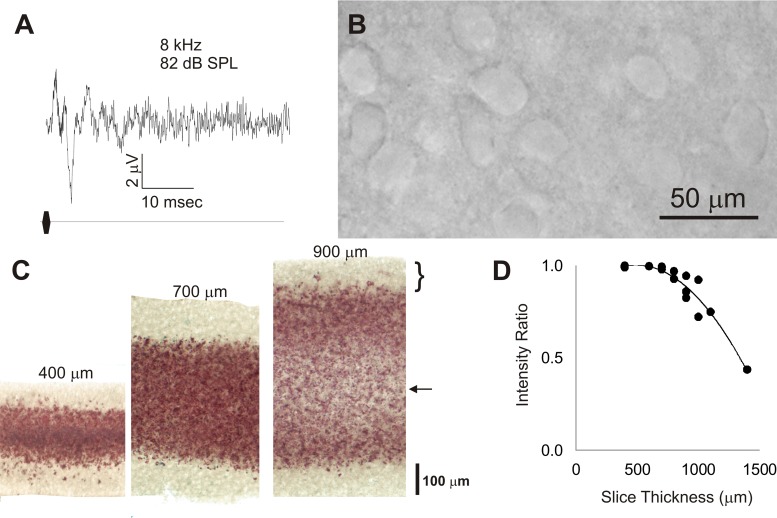
A: auditory brain-stem response taken from a mouse pup at postnatal day 12, taken as an average of 1,000 trials. SPL, sound-pressure level. B: differential interference contrast image from the cerebral cortex of a 600-μm thick slice ∼4 h after slicing. C: 2,3,5-triphenyltetrazolium chloride (TTC)-stained slices obtained from slices cut at 400, 700, and 900 μm. Bracket corresponds to pale area on the perimeter of all of the slices corresponding to poor TTC signal. Arrow corresponds to the pale area in the interior of the 900-μm slice, suggesting poor viability in this portion of the thick slice. D: plot of the ratio of TTC staining intensity in the center of the slice vs. peak intensity just deep to the surface vs. thickness. Data were pooled from 6 different animals. Equation for fit curve: y = −7e−07x2 + 0.0007x + 0.8364, r2 = 0.92.

