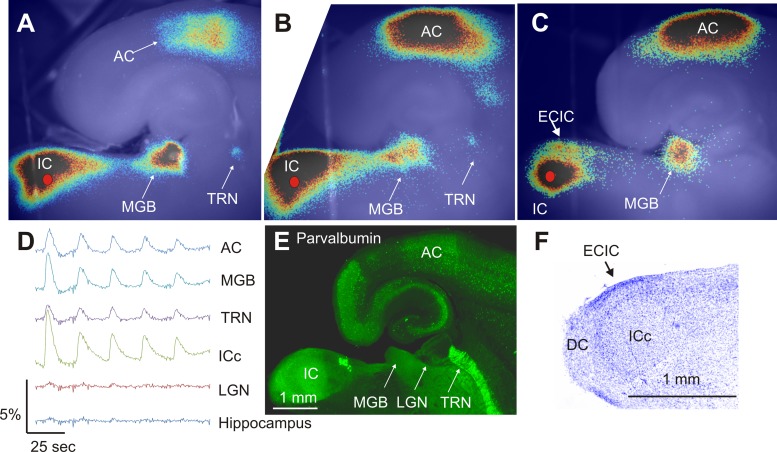
Fig. 3.
Establishing the connectivity and structures within the slice. A: Fourier image demonstrating that electrical stimulation of the inferior colliculus (ICc; red filled circle) produces activation of the MGB, TRN, and AC. B and C: 2 additional slices from other animals demonstrating representative activations. D: time course of activation in 5 different regions of interest taken from the slice shown in A. Each region of interest = a square of 10 × 10 pixels or approximately 280 × 280 μm. E: parvalbumin-immunostained section demonstrating high density of parvalbumin in the AC, IC, MGB, as well as the entorhinal cortex. F: Nissl-stained section demonstrating the presence of the ICc, external cortex of the inferior colliculus (ECIC), and dorsal cortex (DC).

