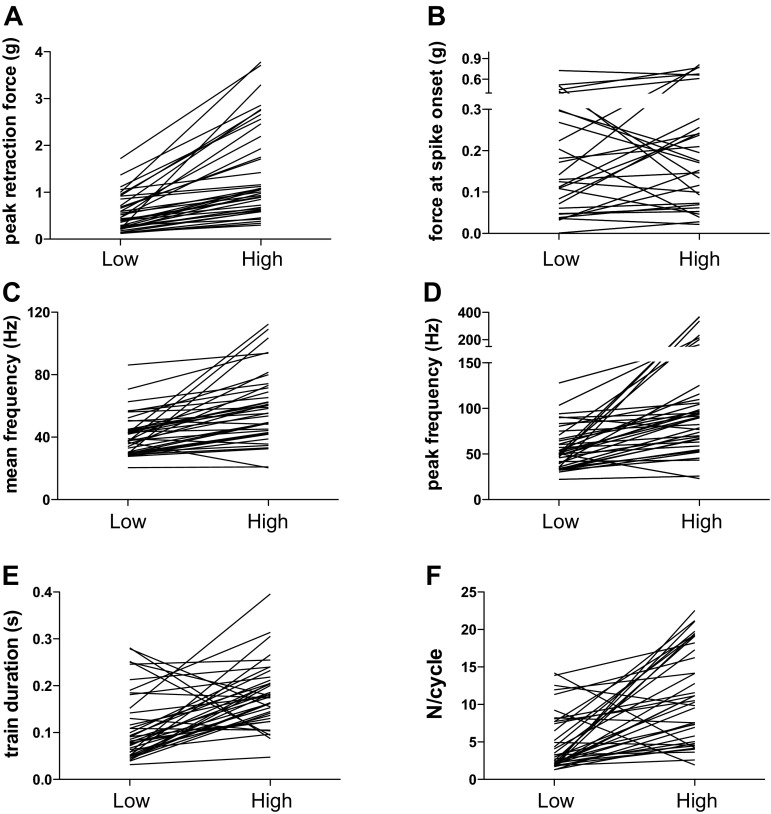
Fig. 3.
Motor unit discharge variables, showing average data recorded at low force and high force for each of the 38 motor units that were studied. A: peak retraction force in grams. B: tongue retraction force recorded at spike onset. C: mean motor unit discharge frequency. D: peak motor unit discharge frequency. E: duration of the motor unit spike train. F: number of spikes per respiratory cycle (N/cycle).

