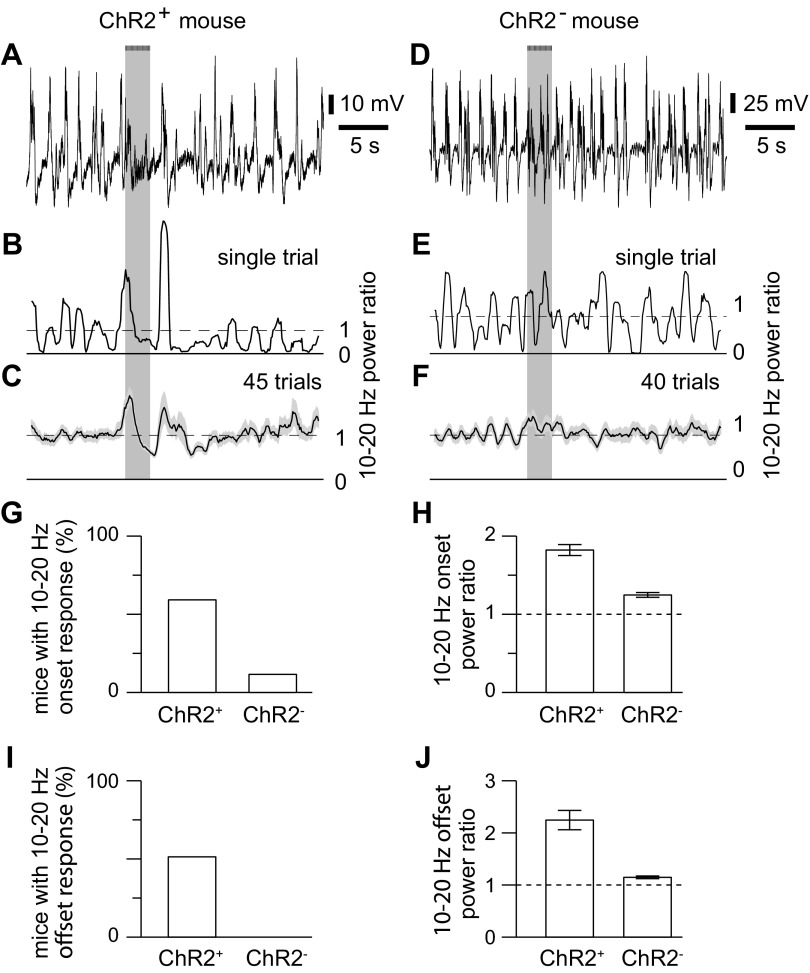
Fig. 10.
Example of high-frequency responses to optogenetic stimulation of cholinergic axons. A: example LFP from a ChR2+ mouse. Bar and light gray shading indicate illumination of the cortical surface with fifty 10-ms light pulses at 20 Hz, starting at 10 s. B: 10- to 20-Hz power ratio for the trial in A. C: mean power ratio from 45 trials. Shading denotes SE. D–F: results from an uninfected mouse, displayed in a similar manner to A–D. G: bar chart, illustrating the percentage of ChR2+ and ChR2− mice that displayed a significant increase in 10- to 20-Hz power at the onset of illumination. H: mean ± SE amplitude of the change in 10- to 20-Hz power at response onset, in ChR2+ and in ChR2− mice which displayed a significant change in 10- to 20-Hz power at response onset. Power ratio of 1 (dashed line) would indicate no change in 10- to 20-Hz power with illumination. I and J: percentage of ChR2+ and ChR2− mice that displayed a significant increase in 10- to 20-Hz power at the offset of illumination.

