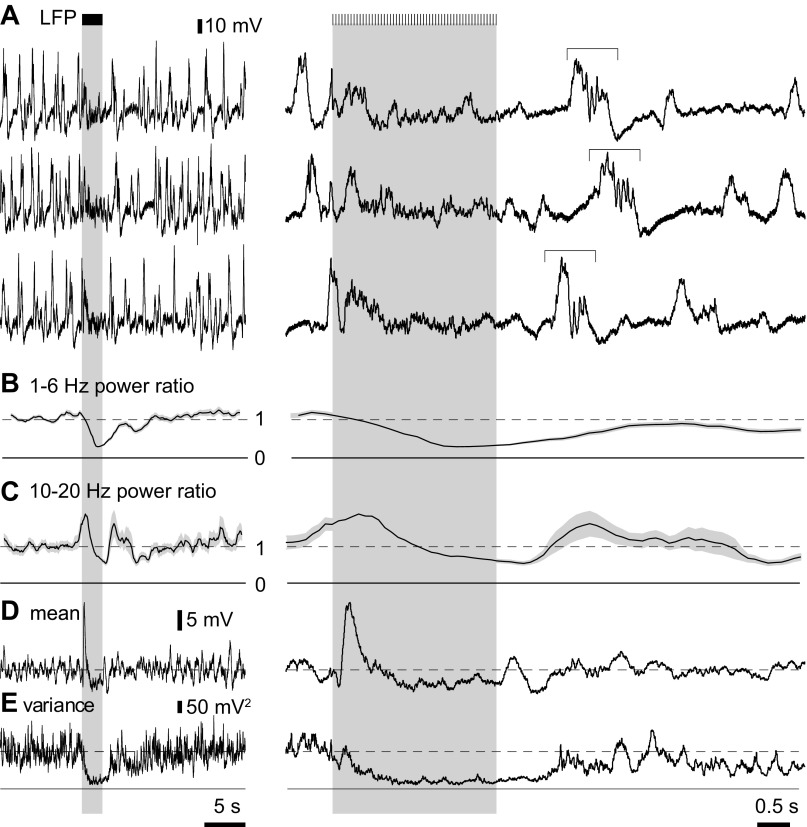
Fig. 11.
Mean and variance of the LFP. A: examples of LFP recordings. Bars and gray shaded areas indicate illumination of the cortical surface with fifty 10-ms light pulses at 20 Hz, starting at 10 s. High-frequency components are visible in many traces, with the offset responses (horizontal bracket) displaying variable timing with respect to the stimulus. B and C: 1- to 6-Hz and 10- to 20-Hz power ratios for a single trial, calculated using 2-s and 1-s windows, respectively. D and E: mean and variance of the LFP for 45 trials in the same mouse. To the right, the LFP, power ratios, mean and variance are shown on an expanded time scale.

