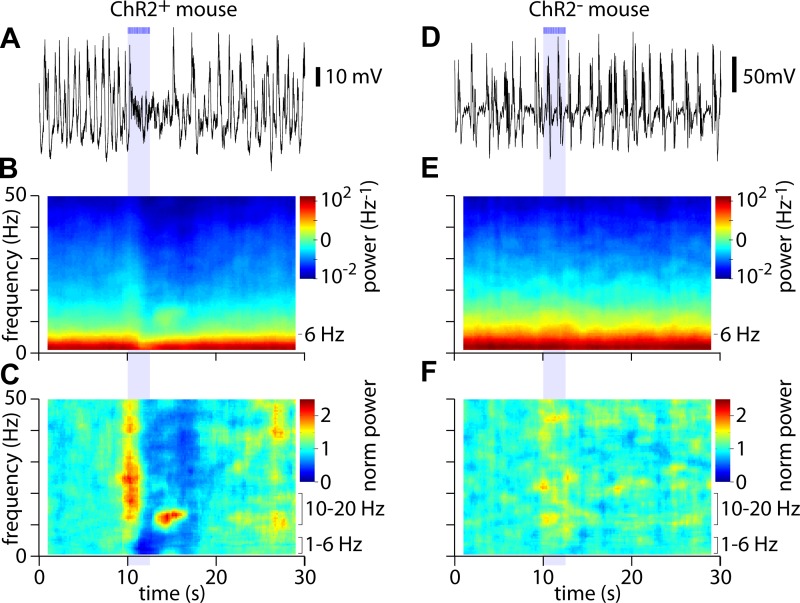
Fig. 2.
Differential modulation of high- and low-frequency power by acetylcholine (ACh) release. A: example of a LFP recording. Bars and shaded area indicate illumination of the cortical surface with fifty 10-ms light pulses at 20 Hz, starting at 10 s. B: spectrogram showing average power over 45 trials for the mouse in A. C: corresponding normalized spectrogram, indicating changes in power at each frequency. D–F: equivalent plots for a mouse with no expression of ChR2.

