
Fig. 6.
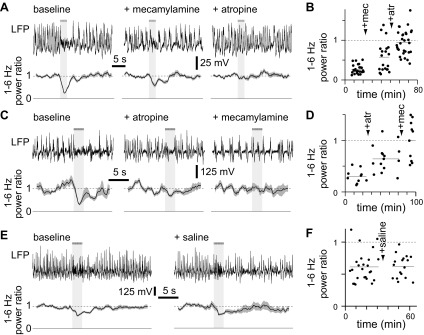
Examples of the effects of mecamylamine and atropine on desynchronization. A: example LFPs (single trials) from a mouse under control conditions, after application of mecamylamine and subsequently atropine. Below, mean (line) ± SE (shaded area) power ratio for each condition (25, 20 and 30 trials, respectively) is given. Solid and dashed lines indicate power ratios of 0 and 1, respectively. The horizontal bar and light gray shading represent the stimulus, which consisted of fifty 10-ms illuminations at 20 Hz. B: power ratio through time for the experiment shown in A, lasting ∼80 min. Each point represents a single trial. The timing of application of mecamylamine and atropine is indicated. The dashed line indicates a power ratio of 1, and shorter horizontal lines indicate the mean power ratio in each condition. C and D: example of an experiment, displayed as in A and B, in which the order of drug application was reversed. There were 10, 15 and 15 trails in control condition, atropine and mecamylamine, respectively. E and F: example of an experiment in which only the vehicle (saline) was applied. Again, results are displayed as in A and B. There were 26 and 16 trials before and after saline application, respectively.