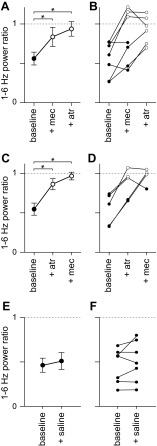
Fig. 7.
Summary of the effects of mecamylamine and atropine on desynchronization. A: mean ± SE power ratio for experiments in which mecamylamine was administered before atropine; n = 7, 7 and 6 mice, respectively. In A and all subsequent panels, solid symbols denote significant desynchronization, open symbols denote conditions in which there was no significant desynchronization, and asterisks indicate changes in power ratio (paired t-test, P < 0.05). B: mean power ratios for each mouse in which mecamylamine was administered before atropine. Lines join points derived from a single mouse. C and D: mean ± SE power ratio for experiments in which atropine was administered before mecamylamine; n = 5, 5 and 4 mice, respectively. E and F: mean ± SE power ratio for experiments in which saline was applied; n = 7 mice.

