
Fig. 8.
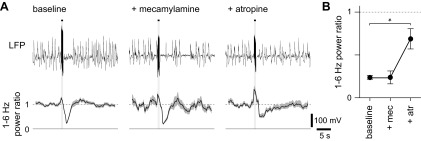
Desynchronization evoked by electrical stimulation of nucleus basalis. A: example LFPs (single trials) from a mouse under control conditions, after application of mecamylamine and subsequently atropine. Below, mean (line) ± SE (shaded area) power ratio for each condition (25, 20 and 30 trials, respectively). Solid and dashed lines indicate power ratios of 0 and 1, respectively. The horizontal bar and light gray shading represent the stimulus, which consisted of seventy-five 0.1-ms electrical pulses at 75 Hz, delivered to nucleus basalis. B: mean ± SE power ratio for electrical stimulation experiments; n = 4, 4 and 3 mice, respectively. Solid symbols denote significant desynchronization, and the asterisk highlights the change in power ratio after atropine application (paired t-test, P < 0.05).