
Fig. 9.
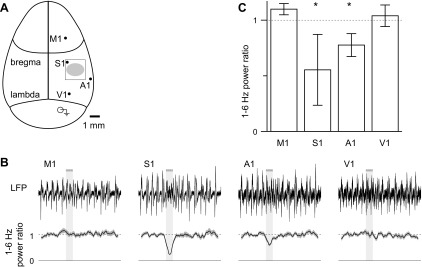
Localized stimulation evokes localized, not global, desynchronization. A: schematic representation of top view of the mouse skull, drawn approximately to scale and illustrating the major suture lines; the locations of electrodes used to measure LFPs simultaneously from primary motor, somatosensory, auditory and visual cortex; the craniotomy over S1 (open rectangle); and the region illuminated with blue light (filled ellipse). B: example LFPs from all four regions. Below, mean (line) ± SE (shaded area) power ratio, 27 trials. Solid and dashed lines indicate power ratios of 0 and 1, respectively. The horizontal bar and light gray shading represent the stimulus, which consisted of fifty 10-ms illuminations at 20 Hz. C: mean ± SE power ratio at each site; n = 3 mice. *Significant desynchronization (paired t-test, P < 0.05).