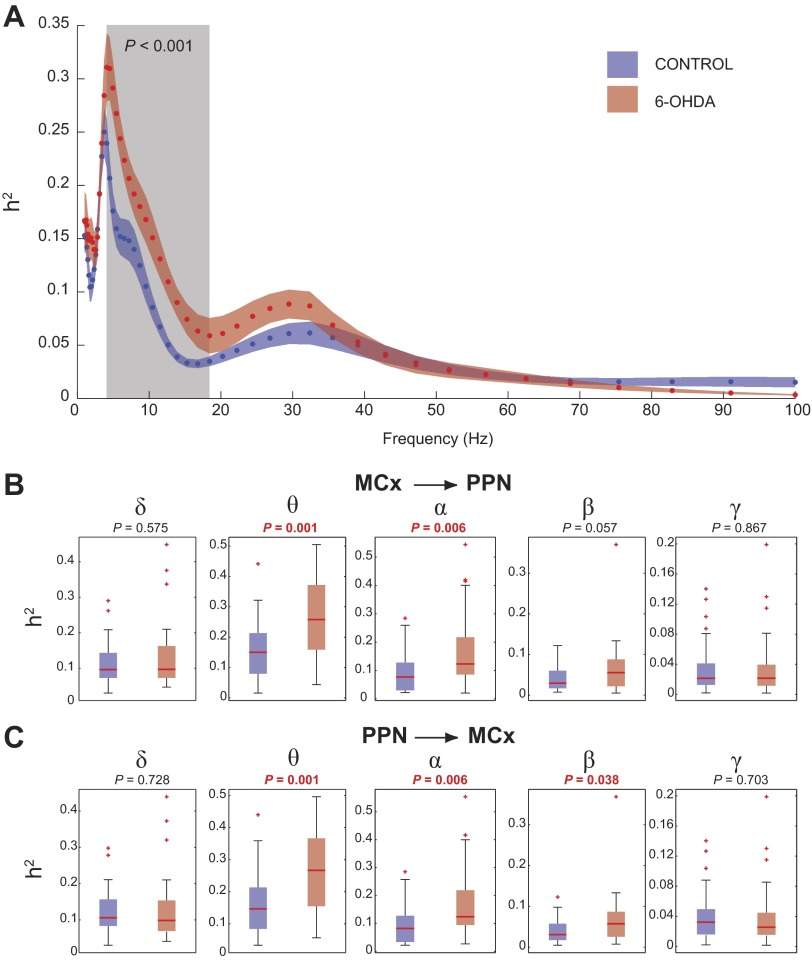
Fig. 2.
Increased cortical drive of PPN oscillatory activity is predominantly observed in the alpha range. A: the comparison of the nonlinear correlation coefficient (h2) between groups shows significant differences in the 4- to 18-Hz range (shaded box; see text). Data are depicted as means ± SE, blue for control animals, red for 6-OHDA. B and C: the computation of the h2 for each band (delta, 1–4 Hz; theta, 4–7 Hz; alpha, 8–12 Hz; beta, 12–30 Hz; and gamma, 30–70 Hz) detected significant differences in the theta and alpha ranges when h2 was referenced to the MCx (B) and in the theta, alpha, and beta ranges when h2 was referenced to the PPN (C). Data in B and C are depicted as medians (red lines) and 90 and 95% confidence intervals; red crosses represent outliers.

