
Fig. 1.
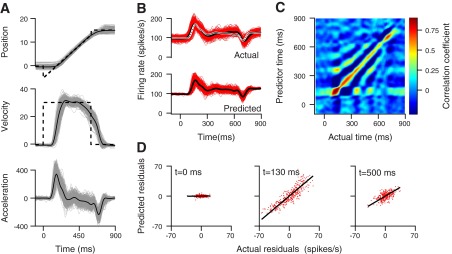
Neuron-behavior correlation (RNB) between firing rate and eye movement for an example floccular target neuron (FTN). A: for eye kinematics, gray traces illustrate single trials, and solid black traces show the average across all trials. B: The 2 sets of traces show actual and predicted firing rate for a FTN neuron. Black and red lines show the averages across trials and many single-trial responses. C: the RNB matrix. The color of each pixel indicates the strength of the trial-by-trial correlation between predicted firing rate at the time on the vertical axis and the actual firing rate at the time on the horizontal axis. D: trial-by-trial correlation between actual and predicted firing rate at 3 separate times: fixation (t = 0 ms), initiation (t = 130 ms), and steady-state pursuit (t = 500 ms). Each point shows data from a different trial. The black lines show the results of linear regression.