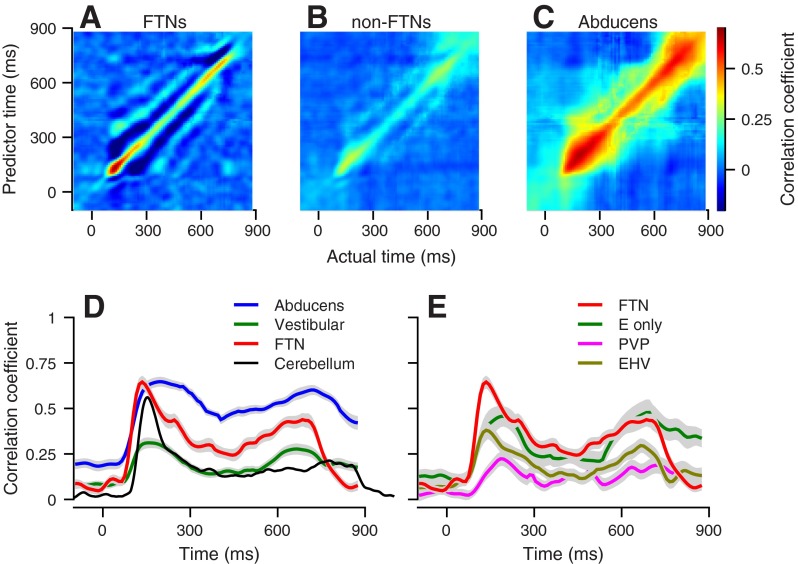
Fig. 2.
Population averages of RNB. A–C: the color of each pixel indicates the strength of the trial-by-trial correlation between predicted firing rate at the time on the vertical axis and the actual firing rate at the time on the horizontal axis for FTNs (A), non-FTN vestibular neurons (B), and abducens neurons (C). D and E: the continuous traces show the value of RNB along the diagonals of the images in A–C as a function of time from the onset of target motion. The shading around the traces shows the SE across neurons. Different colored traces show results for different groups of brain stem neurons, and the black line shows the results for floccular Purkinje cells from Medina and Lisberger (2007). E only, modulation during eye movement with the head stationary but not during cancellation of the vestibuloocular reflex; PVP, position-vestibular-pause; EHV, eye-head velocity.

