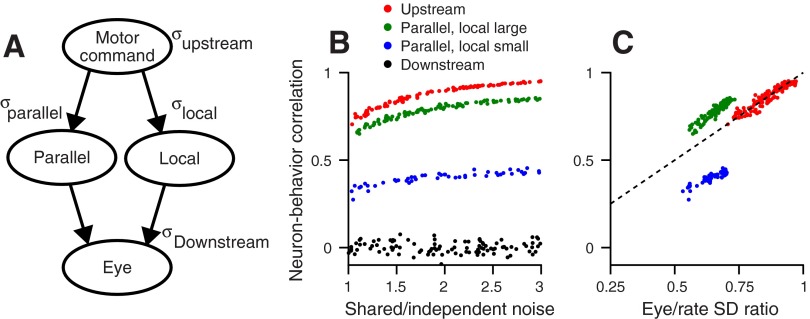
Fig. 4.
Schematic representation and predictions of a generative model for the source of motor variation. A: schematic diagram of the model. The top ellipse represents a neural motor command that is distributed evenly to the 2 parallel groups of neurons represented by 2 middle ellipses. The bottom ellipse represents the eye. The small σ next to each circle represents sources of variation that are common to the local and parallel pools (σupstream), separate for each pool (σparallel), and downstream (σDownstream). B: each symbol plots RNB as a function of the ratio of shared vs. independent variation for an individual model neuron. The red symbols illustrate the result of the simulations with noise generated only upstream. Blue and green symbols illustrate the result of the simulations with variation generated in parallel in the local and parallel populations, with the local pool as the larger (green) or smaller (blue) population. Black symbols illustrate the result of the simulations with all variation generated downstream. C: the predicted relationship between RNB and the ratio of the SDs of neural firing rate and eye movement (SDratio). Colors correspond to the same simulations as in B. The dashed line illustrates the unity line.

