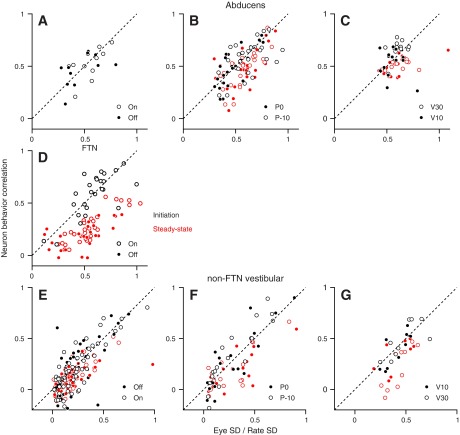
Fig. 6.
The relationship between RNB and SDratio during pursuit. In the scatter plots, each symbol shows data for an individual neuron. Black and red symbols show data for pursuit initiation and steady-state pursuit. The 3 rows of plots show results for abducens neurons (A–C), FTNs (D), and non-FTN vestibular neurons (E–G). In the 3 columns, the different symbols show data for different pursuit conditions. From left to right, the columns used open and filled symbols to compare: pursuit in the on vs. off direction of the neuron under study, pursuit starting from an eye position 10° in the off direction vs. straight ahead, and pursuit of target motion at 30 vs. 10°/s.

