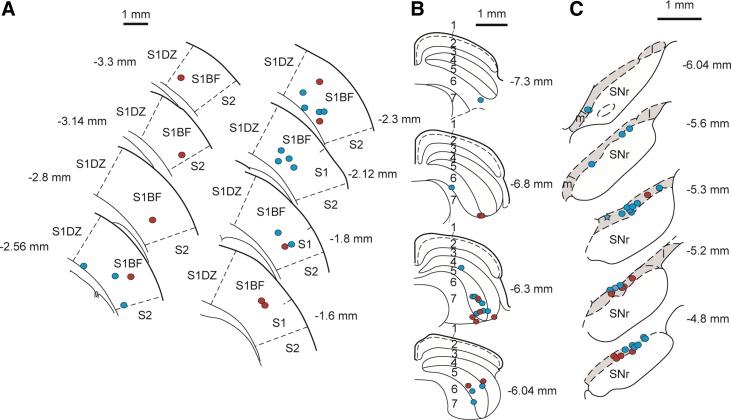
Fig. 2.
Reconstructed plots of stimulation, recording, and injection sites. A: plots of stimulation sites in the cerebral cortex. Colored circles indicate the position of the electrode tips in animals in which pulse trains were applied to the cortex (red) or single pulses were applied to the cortex (blue). S1, primary somatosensory cortex; S1BF, primary somatosensory cortex, barrel field; S1DZ, primary somatosensory cortex, dysgranular region; S2, secondary somatosensory cortex. B: reconstructed plots of recording/injection sites in the superior colliculus. Colored circles indicate the position of the recording/injection sites in animals in which muscimol was injected into the colliculus (red) or bicuculline was injected into the colliculus (blue). The layers are labeled as follows: 1, zonal layer; 2, superficial gray layer; 3, optic layer; 4, intermediate gray layer; 5, intermediate white layer; 6, deep gray layer; 7, deep white layer. C: reconstructed plots of recording sites in the substantia nigra pars compacta (SNc). Colored circles indicate the position of the recording sites in animals in which pulse trains were applied to the cortex (red) or single pulses were applied to the cortex (blue). The point marked with a star represents the location of 2 recorded dopaminergic neurons. The SNc is indicated by shading. m, Substantia nigra medial part; l, substantia nigra lateral part; SNr, substantia nigra pars reticulata. In A–C, electrode positions are reconstructed onto coronal sections, the position of which is given relative to bregma.

