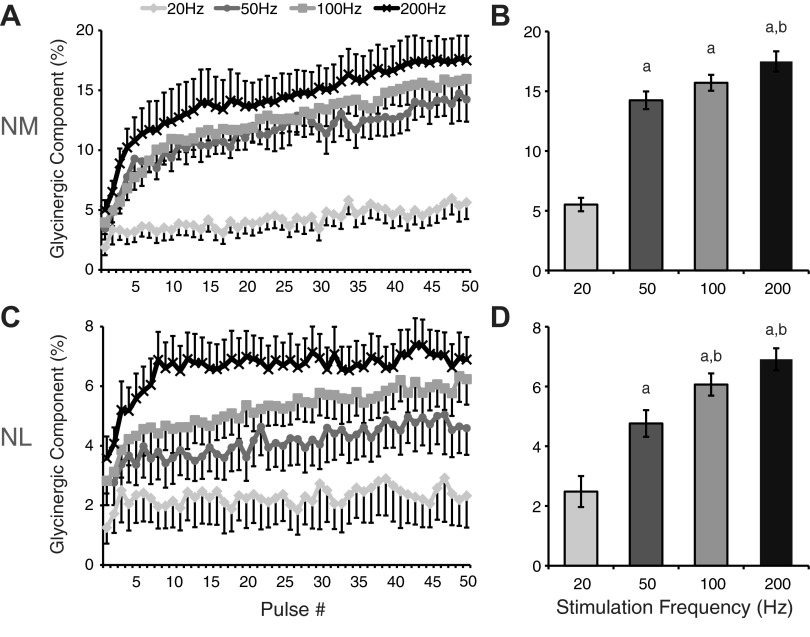
Fig. 5.
Recruitment of glycinergic transmission is dependent on stimulation frequency. A: population data for NM neurons at each frequency for mean amplitude of the glycinergic IPSC component analyzed pulse by pulse during the high-frequency train stimuli. The glycinergic component was calculated by dividing the IPSC amplitude at pulse n in SR95531 by the IPSC amplitude at pulse n in control. B: population data for the magnitude of the glycinergic component at each frequency tested. Values are average ± SE of the last 5 pulses of the stimulus. C: pulse-by-pulse analysis of glycinergic component in NL at each frequency. D: population data for the average magnitude of the last 5 pulses at each frequency in NL. aSignificantly different from 20 Hz (P < 0.001); bsignificantly different from 50 Hz (P < 0.05).

