
Fig. 3.
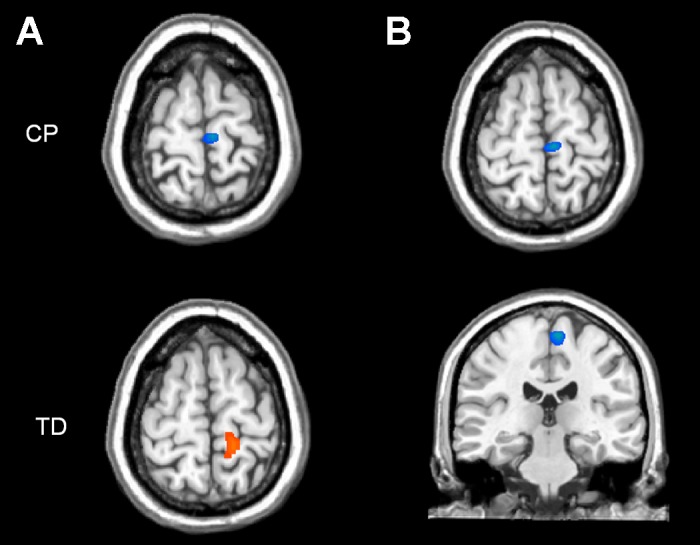
A: statistical parametric maps (SPMs) of the 4- to 14-Hz response from 25- to 275-ms poststimulation for the typically developing (TD) children (bottom) and children with CP (top). Both maps have been thresholded at P < 0.05, cluster-corrected. As can be discerned, both the children with CP and the TD children had activation in the medial wall of the contralateral postcentral gyrus. In addition, it is apparent the children with CP had a desynchronized response (blue) to the external stimulus, whereas the TD children had a synchronized response (orange). B: 2-dimensional SPMs of the group effect for the 4- to 14-Hz response (25–275 ms). Images have been thresholded at P < 0.05, cluster-corrected. As shown, the group difference was in the same region of the medial postcentral gyrus, and was weaker and aberrant in the children with CP. The images are displayed following the radiological convention (right = left).