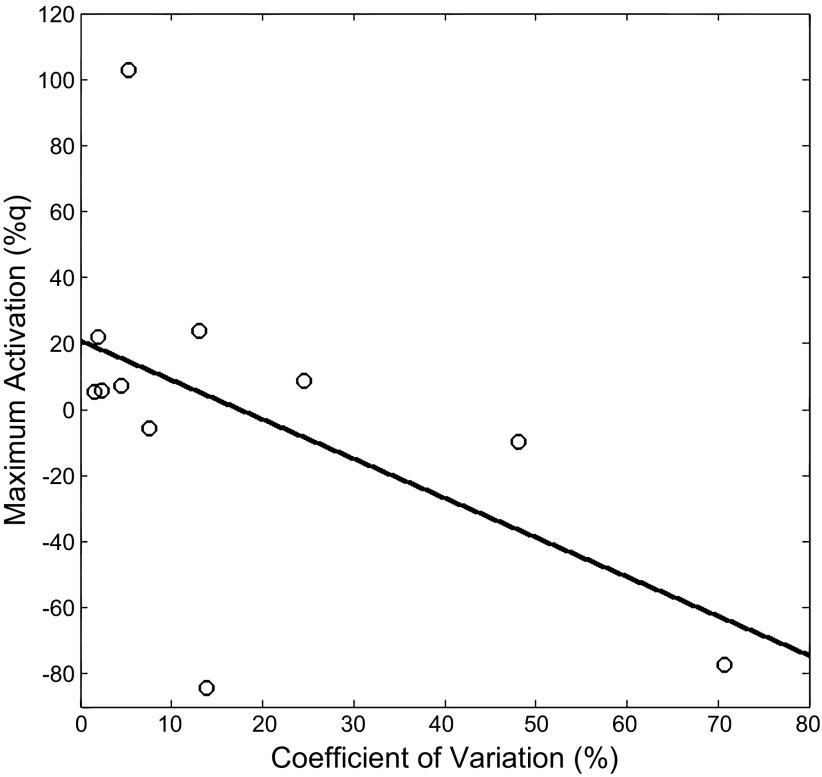
Fig. 4.
Scatter graph of the relationship between the coefficient of variation of the isometric torque and the peak activation in the somatosensory cortices of the children with CP. The graph shows that a larger amount of variability or errors in the steady-state isometric torques was related to a decreased activity in the somatosensory cortices to the tactile stimulation.

