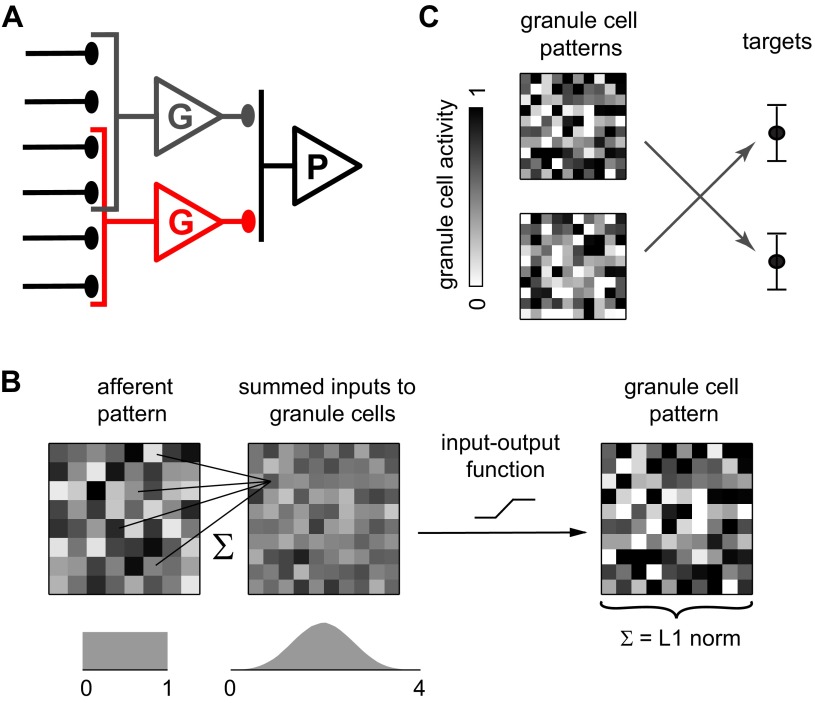
Fig. 1.
Model of synaptic integration and associative learning. A: circuit diagram showing overlapping afferents to 2 granule cells (G). The full model contains 64 afferents, 100 granule cells, and 1 principal cell (P). B: schematic of synaptic integration in the model. Each granule cell receives inputs from 4 afferents for which activities are drawn from a uniform distribution (left). The input to each granule cell is the summed activity of the 4 afferents, resulting in a bell-shaped distribution of inputs (middle). The input-output function of the granule cell then determines its response (right). C: schematic of the learning task. Synaptic weights must be adjusted so that each pattern of activity in the granule cell layer is associated with a target level of synaptic drive to the principal cell. Arrows represent multiplication by the vector of synaptic weights.

