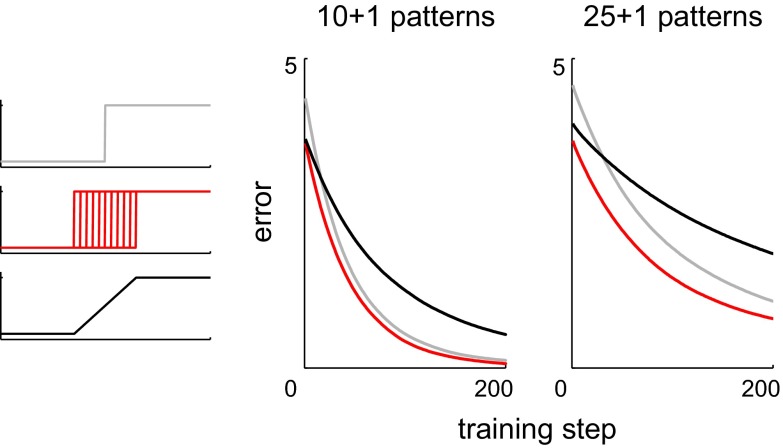
Fig. 2.
Homogeneous and heterogeneous networks compared. A: 5 assignments of input-output functions to the granule cells in the model. First assignment (Step): each cell computes the same step function for which the threshold is the mean of the bell-shaped input distribution in Fig. 1B. Second assignment (Steps): all cells compute different step functions for which thresholds are evenly spaced within 1 SD of the mean of the input distribution. Third assignment (Ramp): each cell computes the same ramp function, which is the mean of all the step functions. The last 3 assignments are related in the same way as the 1st 3. Right: sample granule cell patterns resulting from transformations of the same afferent pattern. B: a set of afferent patterns was fed into a range of networks, including the networks described in A. The resulting sets of granule cell patterns had different statistical properties. Abscissa: coefficient of variation (c.v.) of the distribution of L1 norms. Ordinate: average Euclidean distance between 2 patterns normalized to the value for the Step network. The upper and lower curves show results from heterogeneous and homogeneous networks, respectively. Curves are parameterized by the slope of the input-output functions in the network. Colored markers represent the same networks as in A. C: cumulative histograms of convergence times in 300 trials for training sets containing 15, 20, or 25 patterns. The same afferent patterns were presented to the 5 networks, and the resulting granule cell patterns were used to train the principal cell. D: probability of convergence after 10,000 training steps as a function of the number of patterns to be stored. E: paired trials in which a set of afferent patterns was presented twice to the same network but with different starting synaptic weights in the 2 trials. Scatterplots show starting weights (gray) as well as final weights in the Steps (red) and Ramp (black) networks after training with 5 or 25 patterns. Results from 3 pairs of trials are overlaid. Graphs have different scales, allowing correlations to be compared. F, left: summary plot of synaptic weight correlations after training as in E for the Steps (red) and Ramp (black) networks. Right: expanded view of the indicated part of the summary plot. Values are averages over trials that converged.

