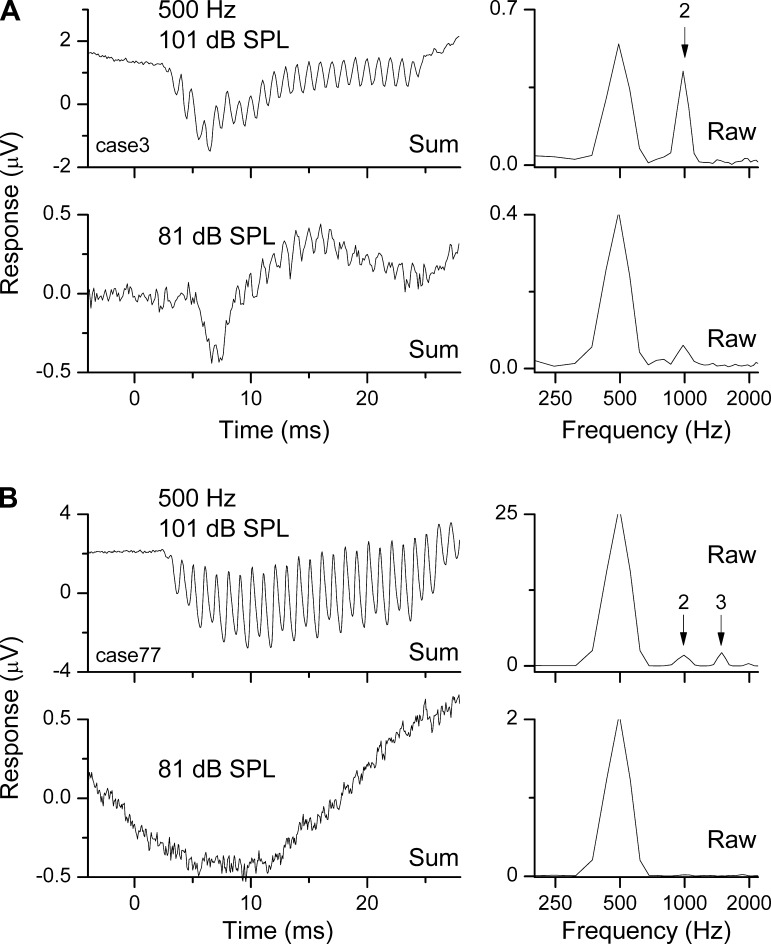
Fig. 11.
Responses from the RW of human subjects just prior to cochlear implantation. A: responses for a subject where the distortion was due primarily to the ANN. Responses to 2 intensities are shown in 2 rows. The summed time series for each intensity is shown at left, and the frequency spectrum for the raw condensation phase is shown at right. Note that the time series therefore does not contain energy at the signal frequency, but the spectrum does. For both intensities, the time series has a CAP and ongoing response at twice the tone frequency of 500 Hz. The dominant distortion is due to the second harmonic, which for the louder sound has nearly the same magnitude as the peak at the tone frequency. B: responses for a subject where distortion was due primarily to the hair cells; same format as in A. There is no CAP apparent in the time series, and little or no second harmonic is evident at the lower intensity. In the frequency spectrum of the more intense sound, there is both second and third harmonics.

