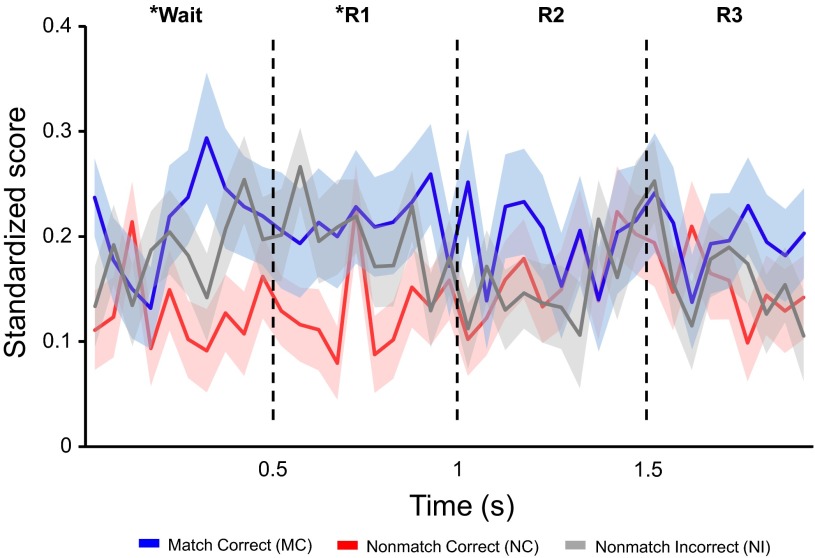
Fig. 8.
Trial effects associated with population activity change during wait and response periods. Each event was 500 ms long, and data shown on the graph were binned into 50-ms intervals. Button-press responses were followed by food rewards at MC trials, compared with when an erroneous response was made on NI trials and no reward was presented. Asterisks denote a significant increase in firing rate for particular 500-ms intervals during MC and NI trials (blue and black lines), relative to NC trials (red line) and MI trials (data not shown). During both the wait and response period 1, results show that population activity for trials associated with the presence of button-press responses (i.e., MC and NI) was higher than those without (i.e., MI and NC). Note that population activity during MI trials was not significantly different from the pretrial firing rate and had significantly less activity than the other three trial types. Population activity during MI is thus not depicted to facilitate visual comparison of the other three trial types on the same graph.

