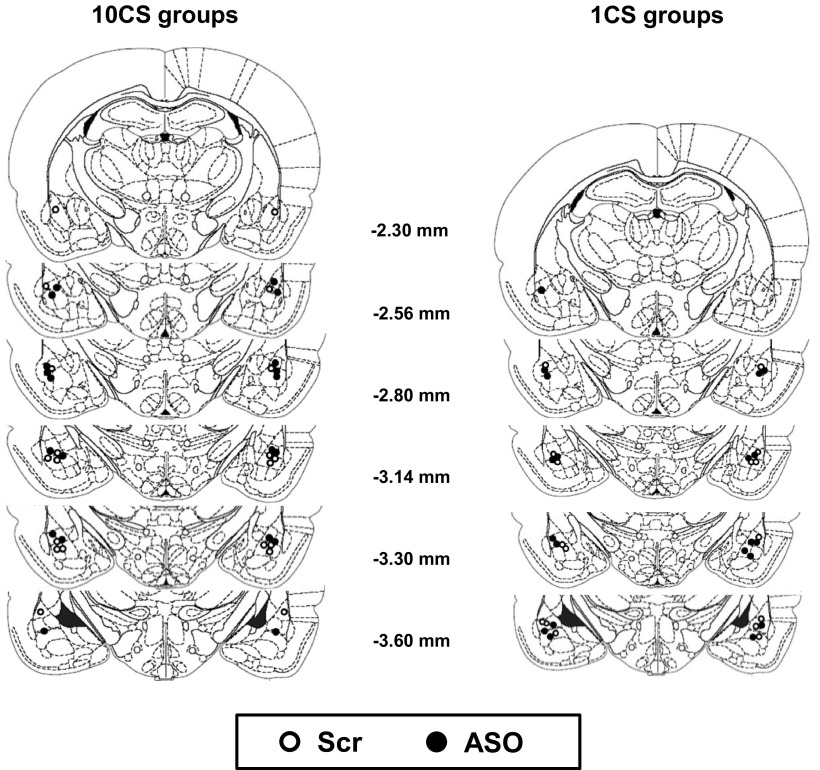
Figure 2.
Schematic representation of the brain showing the placement of the infusion sites in animals in experiments described in Figure 3 (1CS and 10CS groups). All injections sites were within the BLA. Open circles, Scr ODN injections; closed circles, CaN ASO injections. Coordinates are given as distance from bregma. This figure was modified, with permission, from Paxinos and Watson (1998).

