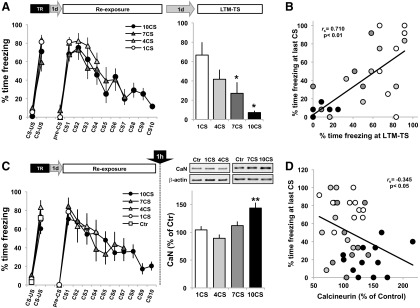
Figure 4.
BLA CaN levels are negatively correlated with the level of conditioned freezing. A, Animals with a fully consolidated fear memory were re-exposed to 1, 4, 7, or 10 CSs and tested 24 h later (n = 8 per group). *p < 0.05 vs 1CS group. B, Level of freezing at the last CS of the re-exposure session versus the level of freezing at the LTM-TS. C, Identical experimental procedure as in A, but animals were killed 1 h after the presentation of 1 CS (n = 12), 4 CSs (n = 7), 7 CSs (n = 8), or 10 CSs (n = 12) along with a Ctr group (n = 16) that received training the day before and was killed directly from the home cage. Left, Level of freezing during the training and CS presentation sessions. Right, Representative Western blot and level of cytosolic CaN in the BLA (Ctr group not shown). Data are presented as means ± SEM. **p < 0.01. D, Correlation analysis between the level of CaN in the BLA and the percentage of time freezing at the last CS of the re-exposure session. Correlations were as follows: number of CS versus freezing level (r(39) = −0.734, p < 0.01); number of CSs versus CaN level (r(39) = 0.518, p < 0.01); freezing level versus CaN level (r(39) = −0.345, p < 0.05).

