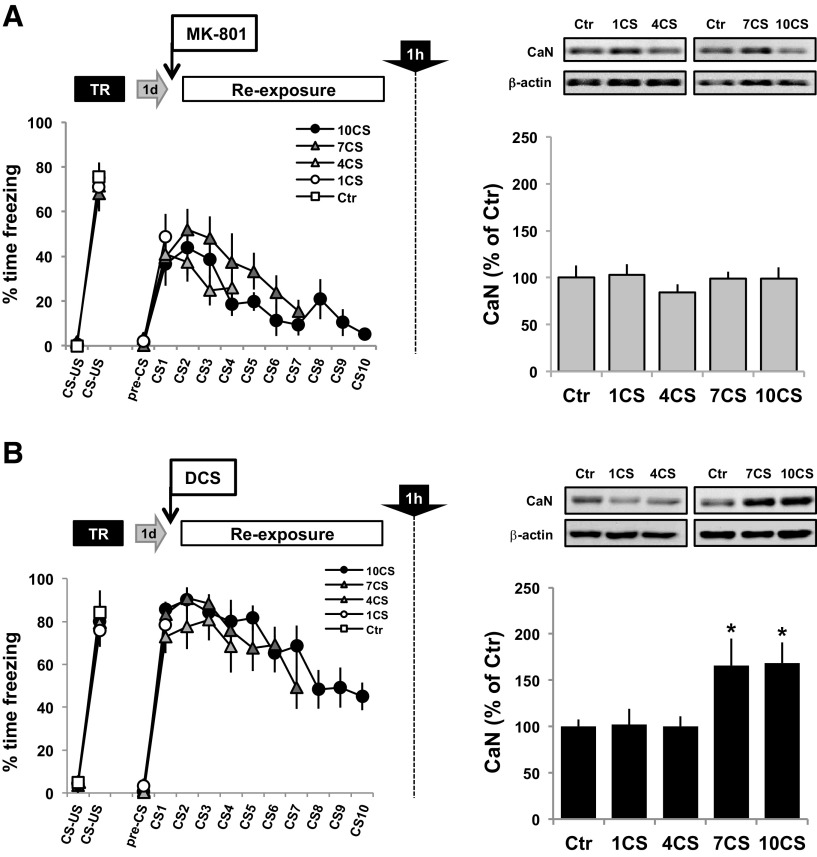
Figure 6.
NMDAR agonist and antagonist treatments modulate levels of CaN in the BLA induced by increasing numbers of CS presentations. The procedure was as described in Figure 4, but all animals were killed 1 h after the CS re-exposure session to quantify the levels of CaN in the BLA. A, B, As control groups, animals were trained, and 24 h later they were injected with MK-801 (A) or DCS (B) and were killed 90 min after from the home cage. Representative Western blot results are shown for each experiment. Bar graphs, Level of CaN in the BLA of animals receiving MK-801 (A) or DCS (B) 30 min before being presented with 1, 4, 7, or 10 CSs. MK-801 groups: Ctr group, n = 7; 1CS group, n = 7; 4CS group, n = 7; 7CS group, n = 8; and 10CS group, n = 8. DCS groups: n = 10 each. *p < 0.05.

