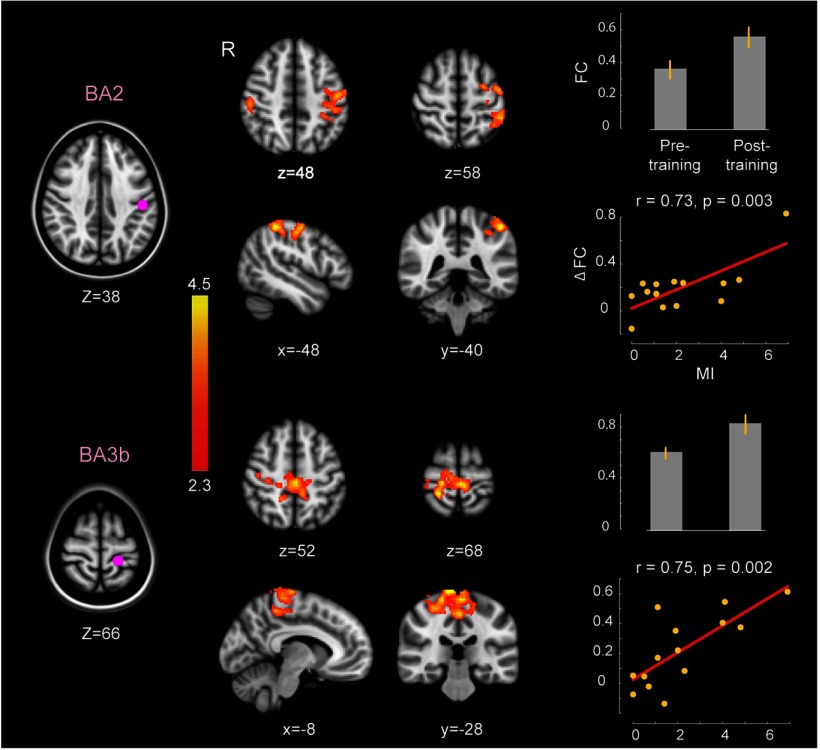
Figure 3.
Changes in connectivity of primary somatosensory areas in relation to motor performance change. Each row shows seed regions at the left, and to the right z-map of clusters whose correlation with the seed region increases reliably as a result of perceptual training. The two panels on the right-hand side of each row give mean measures of connectivity before and after perceptual training, and the correlation coefficient between ΔFCs and changes in motor performance (MI). Subjects who experience greater change in motor behavior show greater changes in connectivity in the resting brain following perceptual training. z-coordinates of cross sections are reported in MNI space. The value of r represents the Pearson correlation coefficient.

