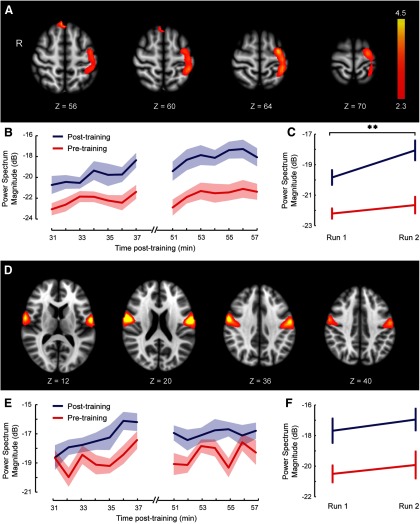
Figure 8.
Resting-state networks specific to the postlearning scans and their temporal power profile before and after perceptual learning. A and D show z-score spatial maps of two specific components corresponding to the postlearning condition, using the SSICA analysis. B and E show the temporal profile of the power of networks shown in A and D at different time points averaged over subjects before (red) and after (blue) perceptual learning. C and F show the mean power of networks shown in A and D in each of the two resting-state runs performed before (red) and after (blue) perceptual learning averaged over subjects. Power magnitudes are given in decibels. Shaded area represents the SEM.

