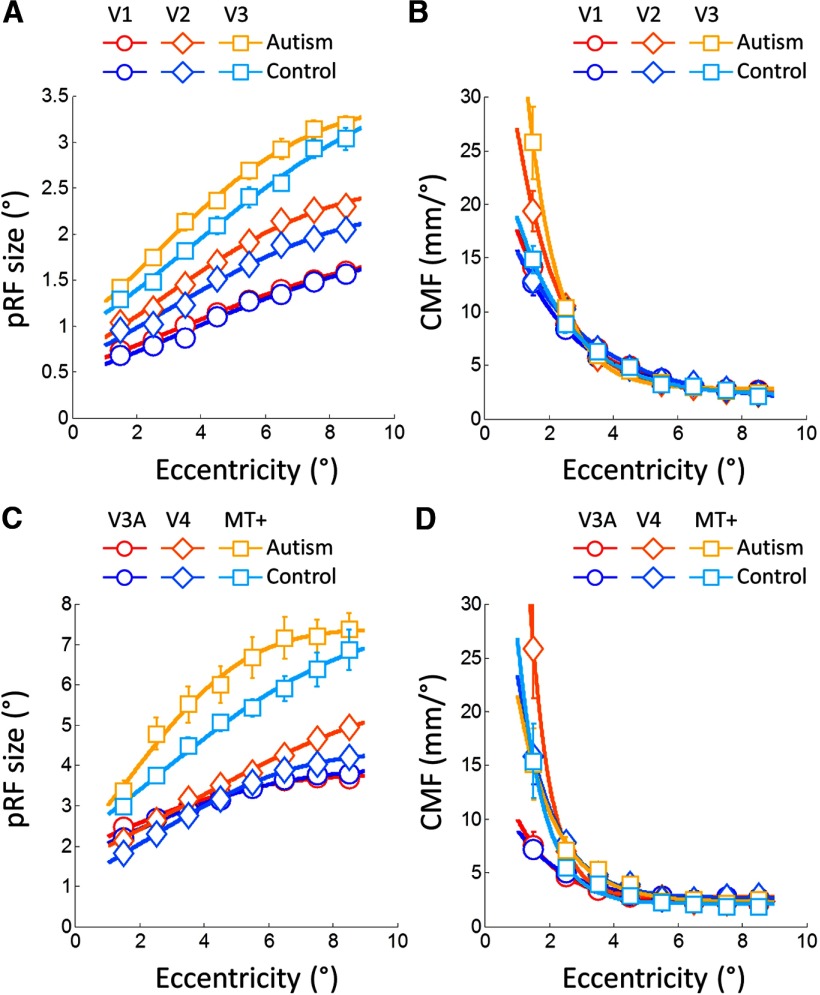
Figure 3.
pRF size (A, C) and cortical magnification factors (B, D) averaged across each group and plotted against eccentricity for early (A, B) and higher visual areas (C, D). pRF became larger with greater eccentricity, whereas cortical magnification decreased. However, in V2 and V3 there were also differences between groups in both measures. PRF sizes were also larger in V4 and MT+. Symbols denote the mean in each eccentricity band, solid lines are curves fitted to these data. Error bars denote ±1SEM (errors were typically smaller than the symbol size). Warm colors, ASD group; cold colors, controls. A, B, Circles, V1; diamonds, V2; squares, V3. C, D, Circles, V3A; diamonds, V4; squares, MT+.

