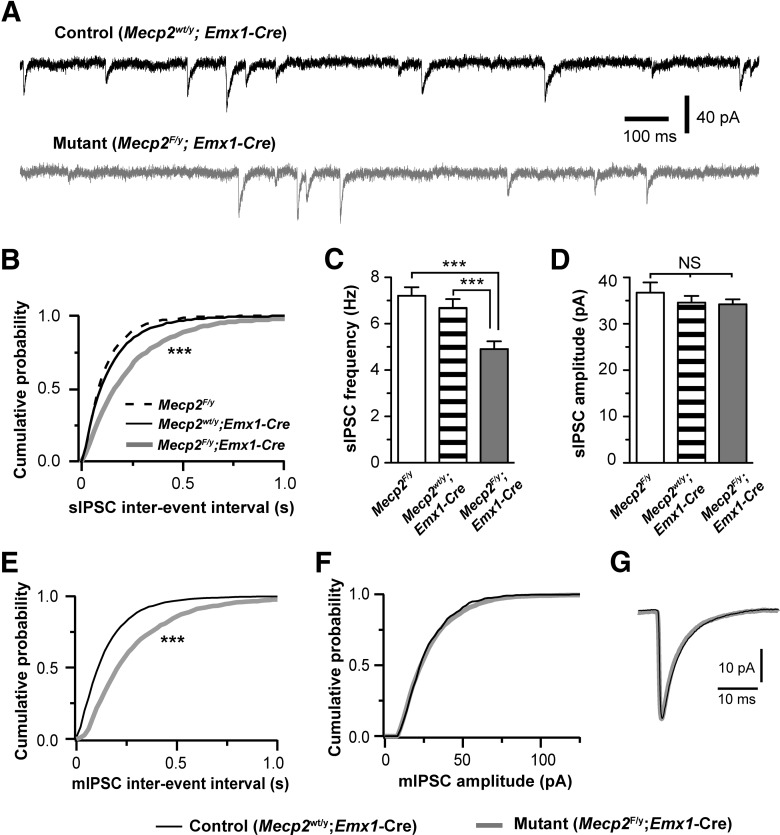
Figure 2.
Deletion of Mecp2 with Emx1-Cre caused reduction in the frequency of sIPSCs and mIPSCs in layer 5 pyramidal neurons in the mPFC at P17–P20. A, sIPSCs recorded from a control (top trace) and mutant (bottom trace) neurons at P18. B, Distributions of sIPSC intervals for mutant neurons (Mecp2F/y; Emx1-Cre, line in gray, n = 25 from 4 mice) and control neurons (Mecp2F/y, dashed line, n = 15 from 2 mice; Mecp2wt/y; Emx1-Cre, line in black, n = 27 from 4 mice). For each group, the distribution was established using 200 consecutive events from each of the recorded cells; p = 0.0007, K–S test. C, The mean frequency of sIPSCs for the three groups (4.9 ± 0.3 Hz for Mecp2F/y;Emx1-Cre; 6.7 ± 0.4 Hz for Mecp2wt/y;Emx1-Cre; 7.1 ± 0.3 Hz for Mecp2F/y; ***p < 0.001). D, The mean peak amplitude of sIPSCs for the three groups (34.2 ± 1.1 pA for Mecp2F/y;Emx1-Cre; 34.6 ± 1.4 pA for Mecp2wt/y;Emx1-Cre; and 36.7 ± 2.2 pA for Mecp2F/y; p > 0.3). The mean decay constant of sIPSC was 5.6 ± 0.3 ms for mutant neurons (Mecp2F/y; Emx1-Cre), 5.5 ± 0.2 ms for Mecp2F/y control, and 5.8 ± 0.2 ms for Mecp2wt/y; Emx1-Cre control (p = 0.53, one-way ANOVA). E, Distributions of mIPSC intervals for mutant neurons (Mecp2F/y; Emx1-Cre, gray) and control neurons (Mecp2wt/y; Emx1-Cre, black). p = 0.0003, K–S test. The mean frequency of mIPSC was 4.5 ± 0.2 Hz (n = 22 from 3 mice) for mutant neurons, and 6.4 ± 0.5 Hz (n = 24 from 3 mice) for control neurons (p = 0.001). F, Distributions of mIPSC amplitude for mutant neurons (Mecp2F/y; Emx1-Cre, gray) and control neurons (Mecp2wt/y; Emx1-Cre, black). The mean peak amplitude of mIPSC was 28.1 ± 1.2 pA for mutant neurons, and 28.5 ± 1.3 pA for control neurons (p = 0.68). G, Averaged mIPSCs for mutant and control neurons. The mean decay constant of mIPSC was 6.1 ± 0.2 ms for mutant neurons, and 5.7 ± 0.2 ms for control neurons (p = 0.08).

