
Figure 6.
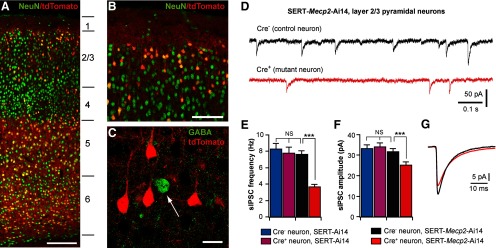
Mosaic deletion of Mecp2 in the cortex selectively disrupts GABAergic transmission in neurons deficient in MeCP2. A, confocal image of the S1 in coronal section of a SERT-Ai14 mouse at P21. Neurons were labeled with anti-NeuN (green); Cre+ cells were identified with tdTomato signal (red). The lines and numbers on the side indicate the locations of the six cortical layers. Scale bar, 200 μm. B, Layer 1 and upper layer 2/3 of S1 at a higher-magnification. Scale bar, 100 μm. Approximately 19% of neurons in upper layer 2/3 were Cre+. C, Layer 2/3 of S1 immunostained for GABA (green). The vast majority of Cre+ neurons (red) in layer 2/3 were pyramidal neurons and negative for GABA. Scale bar, 20 μm. D, sIPSCs recorded from a Cre− (top trace, black) and a Cre+ (bottom trace, red) pyramidal neurons in S1 layer 2/3 of a SERT-Mecp2-Ai14 mutant mouse at P18. E, Mean frequency of sIPSCs from Cre− and Cre+ layer 2/3 pyramidal neurons in SERT-Mecp2-Ai14 mutant and SERT-Ai14 control mice at P17–P18. For mutant mice, the mean frequency was 7.6 ± 0.4 Hz (n = 18, for Cre− neurons, black) and 3.6 ± 0.3 Hz (n = 17, for Cre+ neurons, red; ***p < 0.0005). For control mice, the mean frequency was 8.3 ± 0.7 Hz (n = 17, for Cre− neurons, blue) and 7.8 ± 0.7 Hz (n = 17, for Cre+ neurons, purple). F, Mean peak amplitude of sIPSCs for the four groups. The mean peak amplitude was 31.6 ± 1.6 pA (Cre− neurons in mutant mice), 25.0 ± 1.6 pA (Cre+ neurons in mutant mice), 33.3 ± 1.8 pA (Cre− neurons in control mice), and 34.1 ± 1.9 pA (Cre+ neurons in control mice); ***p < 0.001. G, Averaged sIPSCs for Cre− (in black) and Cre+ (in red) neurons in mutant mice. The decay time constant of sIPSCs was 7.5 ± 0.2 ms (Cre− neurons in mutant mice), 8.4 ± 0.2 ms (Cre+ neurons in mutant mice), 7.4 ± 0.1 ms (Cre− neurons in control mice), and 7.6 ± 0.2 ms (Cre+ neurons in control mice). The decay time of Cre+ neurons in mutant mice was significantly slower than the other three groups (**p = 0.002).