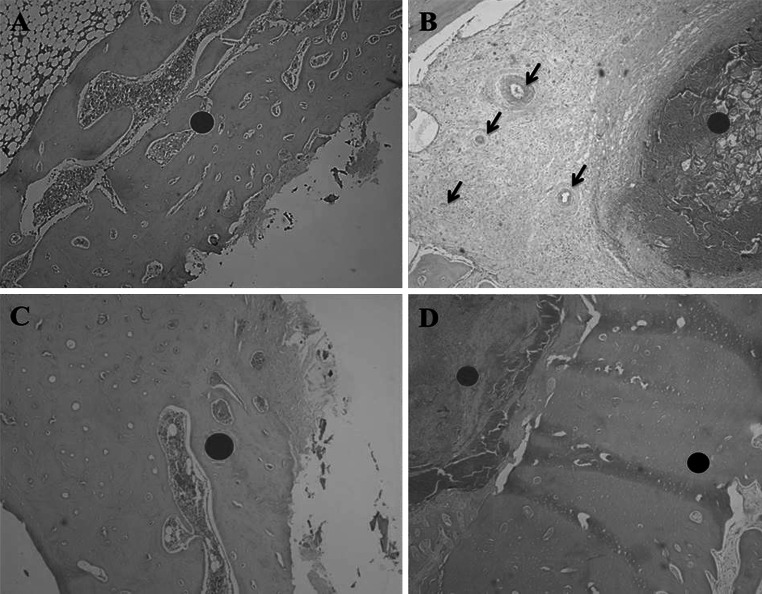
Fig. 2.
Descriptive histological evaluation at day 45. a (Control group); red circle indicates osteotomized site filled by newly formed immature bone. b (QUI group); red circle shows implantation of chitosan surrounded by intense cellular reaction, dark arrows highlight blood vessels. c (TCP group); red circle indicates osteotomized site filled by newly formed bone tissue. d (TCP+QUI group); red circle indicates the implant site with intense cellular reaction around the implant and black circle highlights osteotomized area filled by newly formed bone tissue. Obj. ×4 (Color figure online)

