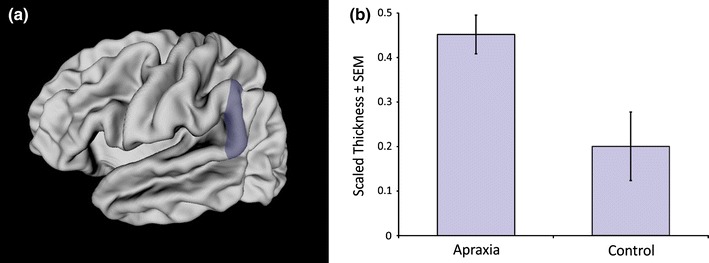
Fig. 1.

a Left posterior supramarginal gyrus ROI, represented as a shaded region on a mid-surface rendering of an average brain; b children with idiopathic apraxia (n = 11) had thicker left posterior supramarginal gyri compared to Controls (n = 11) at baseline, t(20) = 2.84, p ≤ 0.05. Mean scaled cortical thickness (±SEM), shown for each group (Color figure online)
