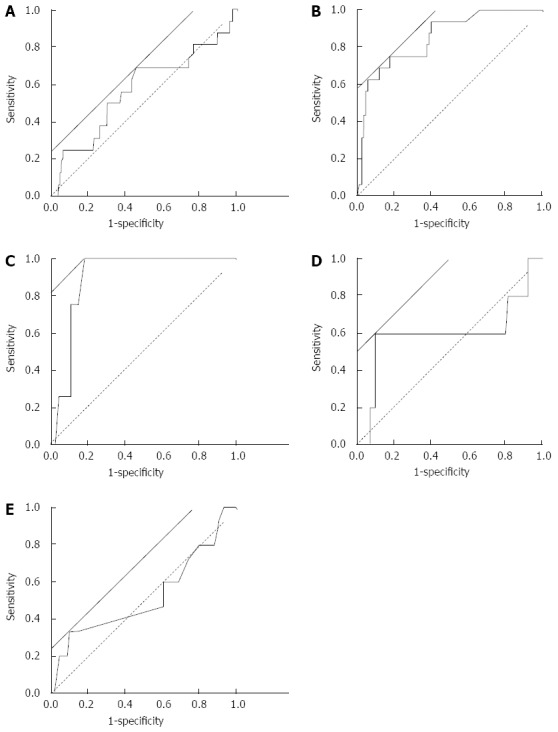
Figure 2.

Receiver operating characteristic curves of the results of change rate of blood examination. Receiver operating characteristic curves were created based on the rate of change in the results of blood examination. The rate of change rate was calculated as a comparison between around the day of endoscopy and 3 mo prior to the date of endoscopy (see text). The analyzed data were white blood cell count (A), hemoglobin (B), C-reactive protein (C), blood urea nitrogen (D), and creatinine (E). Solid straight line, a line with a slope of 45° to calculate threshold by the software (JMP 8.0.2); broken line, reference line.
