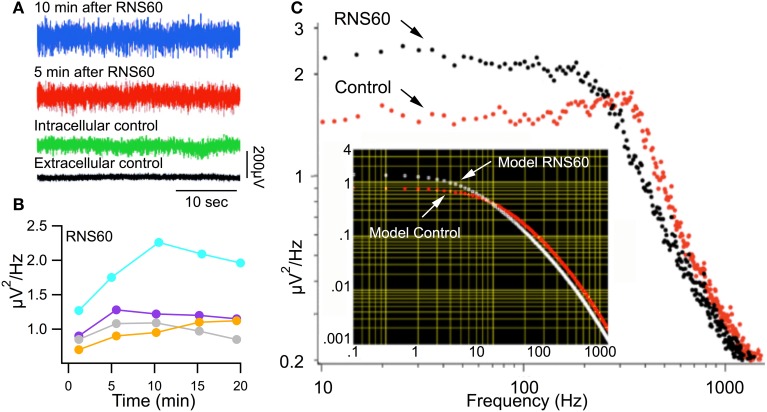
Figure 3.
Synaptic noise recorded in Control ASW and RNS60 ASW. (A) Recordings showing synaptic noise across the postsynaptic membrane superfused with control ASW (green) and the increase in noise amplitude 5 min (red) and 10 min (blue) after superfusion with RNS60 ASW as well as the background extracellular noise recorded directly from the bath (black). (B) Plot of change in noise amplitude as a function of time after superfusion with RNS60 ASW in four synapses. (C) Plot of noise amplitude as a function of frequency (note log scale) in control ASW (red) and 10 min after superfusion with RNS60 ASW (black). The insert shows modeled results indicating that the change in noise could be interpreted as a change in the time course and amplitude of synaptic noise (for details see Lin et al., 1990).

