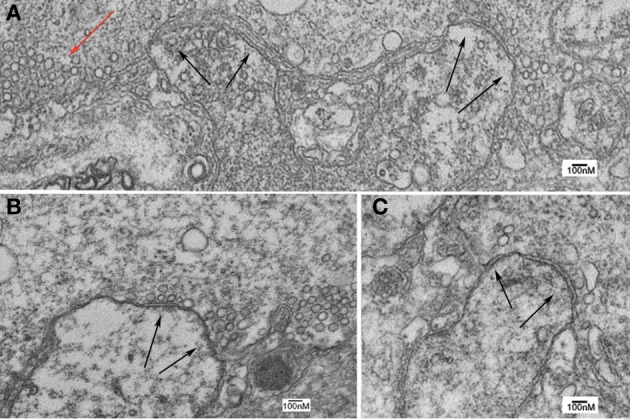
Figure 9.

Ultrastructure of squid giant synapse active zones following oligomycin injection. (A–C) Black arrows indicate active zones showing few, if any, synaptic vesicles. Note also the lack of clathrin-coated vesicles and of large vesicular profiles that are generally found in the presence of synapses superfused with RNS60 ASW. Note also the presence of a few vesicles scattered away from the active zone (red arrow).
