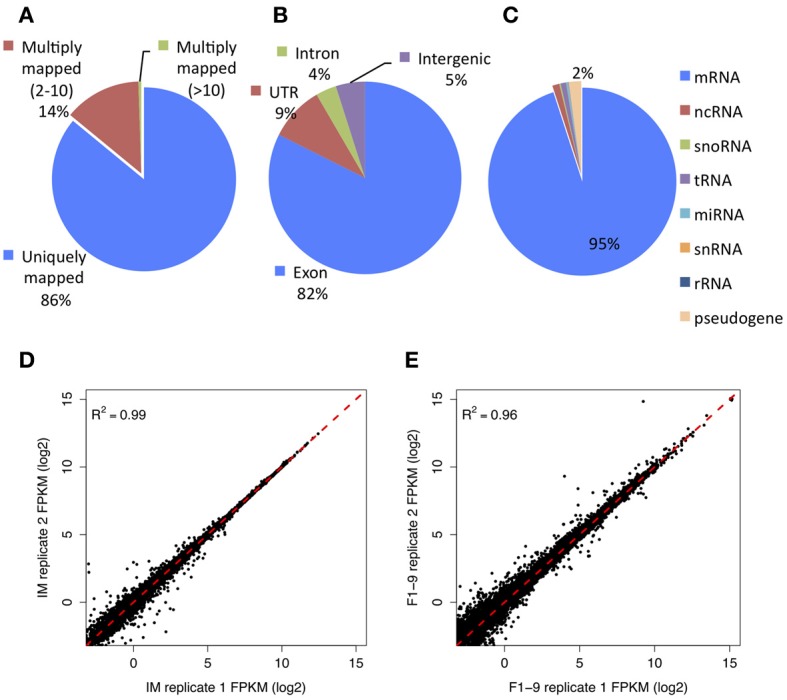
Figure 1.

The details of reads mapping and reproducibility of RNA-Seq data. (A) Distribution of aligned reads, which are mapped either uniquely or to multiple positions on the genome. (B) Percentage of reads distributed to exons, introns, and untranslated or intergenic regions. (C) Classification of detected genes by annotated genomic features (percentage: mRNA 0.95; ncRNA 0.01; snoRNA 0.002; tRNA 0.009; miRNA 0.003; snRNA 0.0004; rRNA 0.0005; pesudogene 0.021). (D) Gene expression comparison between the two technical replicates for the inflorescent meristem (IM) stage. (E) Same comparison for flower development stage 1 to stage 9 (F1–9).
