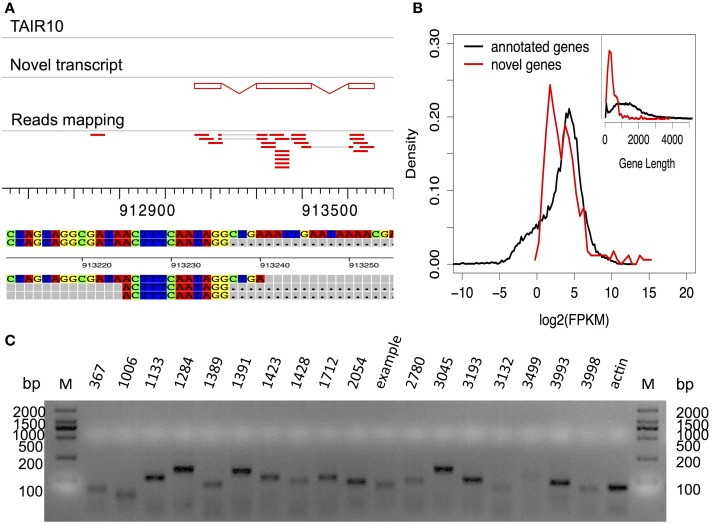
Figure 5.
Analysis of novel identified transcripts. (A) Display of a novel transcribed region identified by RNA-Seq analysis. It includes three exons, supported by short reads (in red bars). Detailed alignment information (first exon-intron junction) is given in the lower panel. (B) Comparison of the expression values of novel transcripts and annotated genes. Comparison of gene lengths is given in the upper right panel. (C) RT-PCR validation of 18 randomly selected novel transcribed regions.

