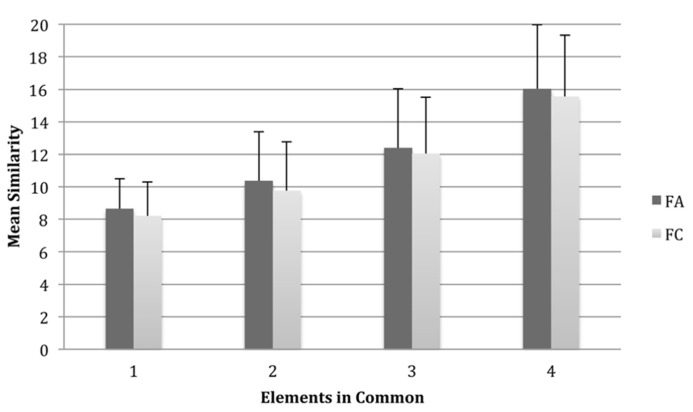
FIGURE 2.
Mean similarity ratings for exemplar Fribbles for each possible configuration of elements in common with the prototype Fribble for both species FA1 and FC1. Similarity was scored on a scale ranging from 1 to 20 where “1” represented a highly dissimilar stimulus and “20” a highly similar stimulus. Higher means scores indicate greater similarity with the prototype. Error bars are one standard deviation.

