
Figure 2. Interaction plot of estimated marginal means calculated for temperature at each level of biofilm age.
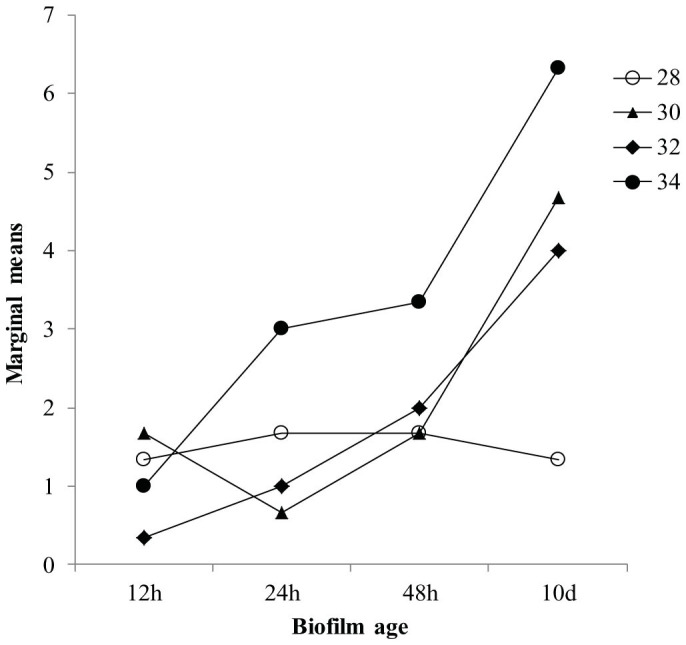
Insert legend represents temperatures (°C).
Official websites use .gov
A
.gov website belongs to an official
government organization in the United States.
Secure .gov websites use HTTPS
A lock (
) or https:// means you've safely
connected to the .gov website. Share sensitive
information only on official, secure websites.
Insert legend represents temperatures (°C).