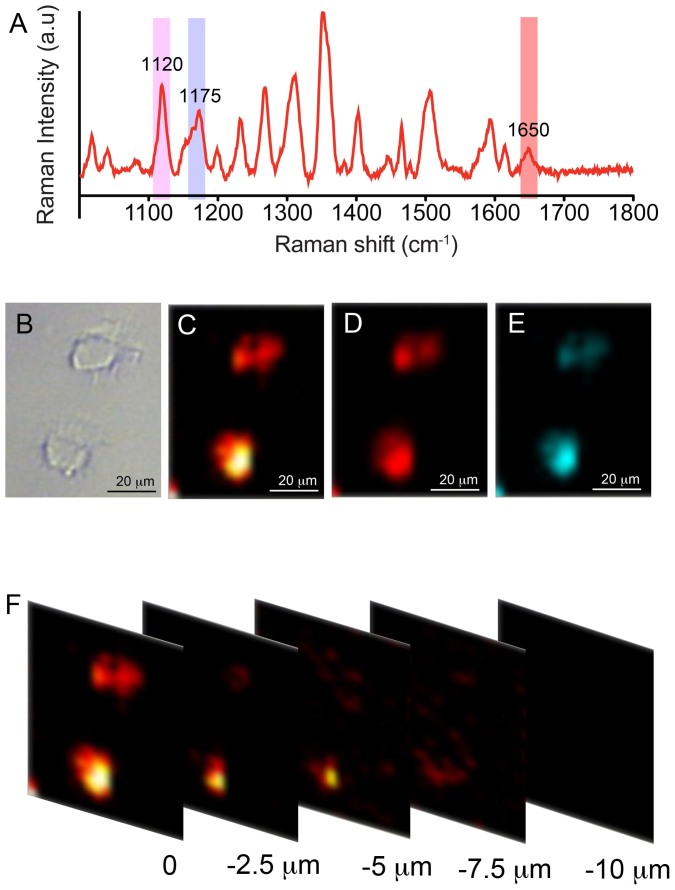
Figure 3. In vitro SERS mapping results with three SERS nanotags.
(A)- SERS spectra from the cell depicting the multiplexing peak from each nanotag bound to corresponding biomarker on the cell surface and (B)-bright field image of the cell. (C–E) shows the SERS intensity map image demonstrating the expression and relative distribution of the biomarkers- TGFβRII, CD44 and EGFR on the cell surface bound to the antibody conjugated SERS nanotags, Cy5, MGITC and Rh6G respectively. SERS mapping was carried out at 1120 cm−1 peak of Cy5, 1175 cm−1 of MGITC and 1650 cm−1 of Rh6G. (F) SERS intensity map images of the z-series scan at different depth for the Cy5 nanotag (bound to TGFβRII biomarker). Mapping was carried out at a depth interval of 2.5 μm.

