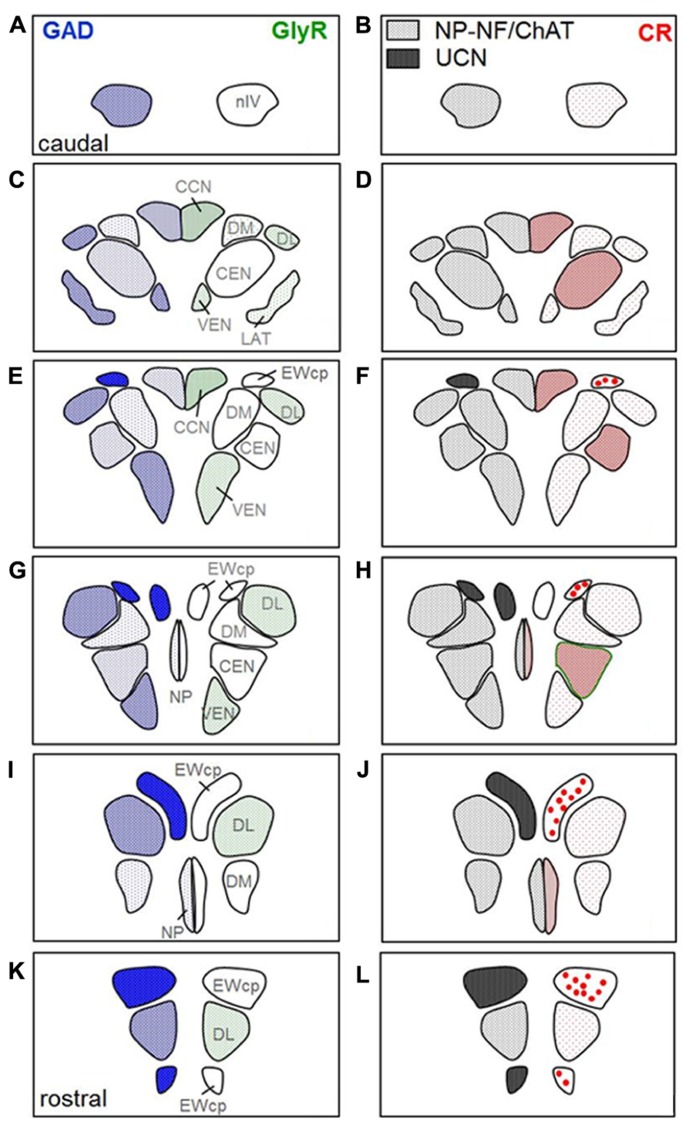
FIGURE 6.
Two parallel series of drawings of transversal sections through the trochlear (nIV) and oculomotor nucleus (nIII) complex arranged from caudal to rostral. Panels (A,B) correspond to the level of Figure 1, (C,D) to the level of Figure 2, (G,H) to the level of Figure 3, and (K,L) to the level of Figure 5. Panels (E,F and I,J) correspond to additional intermediate levels. On the left, the density of glutamate decarboxylase (GAD) positive puncta and the intensity of immunostaining for the glycine receptor (GlyR) in the different subgroups is indicated by blue hatching on the left and green hatching on the right, respectively. The right column shows the presence of neurons expressing immunoreactivity for urocortin (UCN, black), non-phosphorylated neurofilaments (NP-NF; gray) and calretinin (CR; red filled circles). The density of CR-positive profiles is indicated by different grades of red hatching.

