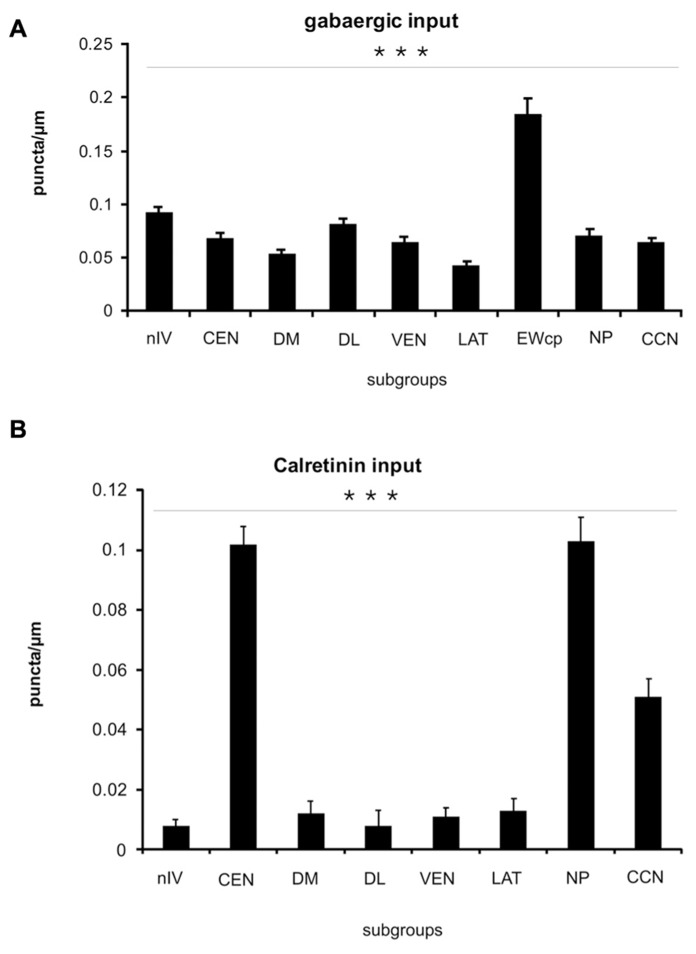
FIGURE 7.
Histogram of the quantitative analysis of GABAergic and calretinin (CR) input to motoneurons in the oculomotor and trochlear nucleus. The values are given in Table 3. (A) The GABA-input was quantified by counting glutamate decarboxylase-positive (GAD) puncta along the measured length of the contour of a given neuron. The mean terminal density of input and the standard error of the mean values were calculated for each subgroup. The one-way analysis of variance revealed a significant difference (p < 0.001). The strongest input is seen to non-preganglionic centrally projecting neurons in the Edinger–Westphal nucleus (EWcp; compare to Figure 4O), whereas the neurons of all other subgroups did not show major differences. (B) The strongest CR input is seen to neurons of the nucleus of Perlia (NP), the central group in oculomotor nucleus (CEN), and the central caudal nucleus (CCN). The number of counted CR-positive puncta associated with putative upgaze motoneurons is significantly higher compared to those around horizontal – and downgaze motoneurons (***p < 0.001).

