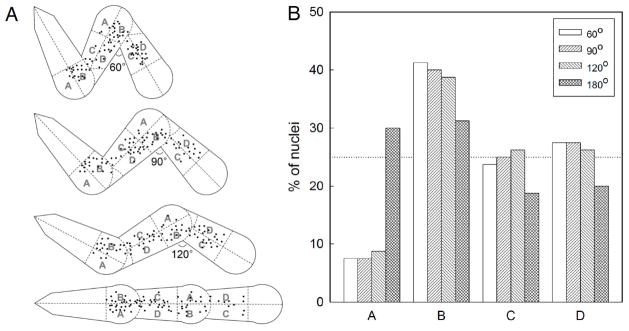
Fig. 4.

Cells move slower as their nucleus pass through the turns. (A) Centroid of cell nuclei measured at 6 hour intervals from 80 images for each pattern design. Each teardrop is divided into regions A, B, C, and D of equal area. (B) Percentage of nuclei in each region.
