Abstract
Introduction
The human prostate gland contains all the compounds of the renin-angiotensin system (RAS), including AT1 and AT2 angiotensin receptors. The role of local RAS in the prostate pathology is recently discussed. The aim of the present study was the evaluation of AT1 and AT2 expressions in human prostate cancers.
Material and methods
The investigation was performed in 20 paraffin-embedded needle biopsy specimens from routine diagnostic prostate cancer biopsies. The specimens were stained with hematoxylin and eosin and immunostained with anti-AT1 and anti-AT2 antibodies. For visualization of primary antibodies, the streptavidin-biotin-peroxidase technique was applied. The expression of both receptor proteins was evaluated quantitatively using image analysis method.
Results
The positive immunostaining with both anti- AT1 and anti-AT2 antibodies can be found in stromal as well as epithelial structures. The results of quantitative evaluation showed the positive correlation between AT1 and AT2 expressions in neoplastic epithelium and overexpression of both AT1 and AT2 in neoplastic epithelium of Gleason grade 2, but not in cancerous structures of Gleason grades 3-5.
Conclusions
The data on AT1 and AT2 receptor expressions may suggest the involvement of RAS in prostate cancerogenesis. Moreover, the persistence of AT1 receptors in prostate cancer speaks in favor of attempts to use of AT1 receptor blockers (i.e. sartanes) and/or AT2 agonists in prostate cancer prophylaxis and/or treatment.
Keywords: angiotensin receptors, AT1, AT2, prostate cancer, immunohistochemistry, quantitative evaluation
INTRODUCTION
Angiotensin II (Ang II), the main biologically active product of the renin-angiotensin system (RAS), is perceived mostly as an important regulator of the circulatory system, involved in pathogenesis of the arterial hypertension and atheromatosis. However, besides these traditional roles, Ang II, produced in the numerous local RAS within the different organs and tissues, plays other important functions. The human prostate gland contains all the compounds of RAS: angiotensinogen, renin, and angiotensin converting enzyme (ACE) as well as both main subtypes of Ang II receptors, AT1 and AT2 [1, 2]. The role of Ang II in prostate remains unclear, but many data suggest that this peptide is involved in the control of prostate growth. In rats, captopril, an ACE inhibitor, induces the suppression of prostatic epithelial cell proliferation, which is reversed by Ang II [3]. ACE and Ang II were found to be over-expressed in benign prostate hyperplasia. It was hypothesized that the increased local production of Ang II is a factor contributing to pathogenesis of the disease [4, 5]. It has also been shown that Ang II stimulates the cell growth of prostate cancer cell lines LNCaP and DU145 [6]. On the other hand, angiotensin III and IV, the smaller fragments of Ang II, inhibited the growth of DU145 cancer cell line [7]. The data on the expression angiotensin receptors in prostate cancers are relatively scarce. Moreover, they concern mostly established cancer cell lines in vitro and were done using a polymerase chain reaction (PCR). AT1 receptor mRNA was found in androgen-dependent LNCaP and androgen – independent DU145 and PC3 cell lines [6, 8, 9]. On the other hand, AT2 receptor mRNA was detected in LNCaP and PC3 [8] but not in DU145 cells [8]. Both AT1 and AT2 receptor expression was found not only in the above mentioned cell lines, but also in tissue samples of human prostate cancers [6, 10]. It was found that (in contrast to BPH) AT1 mRNA is overexpressed in malignant prostatic tissue in comparison to normal prostatic tissues [6]. However, the expression of AT1 is higher in well differentiated than in poorly differentiated cancers [11]. In the present study, we attempted to detect AT1 and AT2 receptor proteins in tissue samples of prostate cancers by means of the immunohistochemical method.
MATERIAL AND METHODS
Material
The investigation was performed in needle biopsy specimens from the routine diagnostic prostate biopsies of 16 men aged 60 to 85 (mean 69.75 years). The diameter of tissue needle biopsy specimens was 0.8 mm and the length was 1.0 to 1.5 cm. For analysis, 20 specimens embedded in paraffin were chosen. All the specimens include 20 to 90% of carcinomatous tissue graded as 2, 3, 4, 5 cancer, according to Gleason score. The specimens were serially cut, stained with hematoxylin and eosin, and assessed for additional immunohistochemical reactions.
Methods
Gleason scoring
Gleason score in all sections was established according to the 2005 ISUP Consensus on Gleason Grading of prostatic carcinoma [23]. In all cases, Gleason score was established by two pathologists with experience in urological pathology and, if the diagnosis of the two pathologists was varied, the specimen was excluded from the research.
Immunohistochemistry
AT1 immunostaining was performed using the anti–AT1 polyclonal antibody (sc-1173). This antibody was raised against the N-terminal extracellular domain of AT1 receptor and recog nizes human, rat, and mouse receptor protein. AT2 receptors were revealed using the sc-9040 polyclonal antibody raised against the 221-303 fragment of the human AT2 receptor protein. The antibody detects human, rat, and mouse AT2 receptors. Both antibodies were purchased from Santa Cruz Biotechnology, CA, USA. The anti-AT1 and anti-AT2 antibodies were applied in working dilution of 1:100. The visualization of primary anti-receptor antibodies was done using the StreptABComplex/HRP Duet (Dako Cytomation) following the procedure recommended by the producer. In brief, the biotinylated goat antibody against rabbit and mouse immunoglobulin was applied as the secondary antibody, which was followed by streptavidin-biotinylated horseradish peroxidase complex and 3,3’-diaminobenzidine (DAB) as chromogen. The laboratory procedure was strictly standardized and uniformed (eg. the samples were performed by the same, skilled, experienced person, the fixing time ranged from 16 to 20 hours, the thick of biopsy specimens was always 0.8 mm, the reagents were fresh, and the times and temperature were strictly controlled).
Quantitative evaluation of immunostaining
The expression of both receptor proteins was evaluated quantitatively using the image analysis methods described previously [15]. The software tool used for immunoquantification was ImageJ ver 1.42p developed at the US National Institutes of Health (http://rsb.info.nih.gov/ij/). The microscopic images were gathered as RGB digital images (24 bits per pixel) using an Olympus camera (type C7070) with a linear resolution of 5.6 pixels per 1 micrometer under original magnification approx. 400x, and under the same lighting parameters (the automation of camera was switched off). For the analysis, the images with carcinomatous tubules (or solid infiltration in the case Gleason 5 cancers), non-neoplastic tubules, and/ or capillary vessels were recorded. All these structures were lying in the vicinity, i.e. were visible in one medium power field (magnification 100 x). The red cells that were not superimposed in the vessel acted as the reference densitometric value for determination of the residual peroxidase activity, which manifested as a trace expression of DAB. In each investigated case, the image analysis was performed in 5-6 fields, each measuring 0.232 mm2. The image analysis procedure consists in conversion of tubule crosssections image, in order that the resulting image for densitometric measurements was the mask of „pure” cytoplasmatic outlines with DAB staining, without tubular lumina, intercellular space or shapes of nuclei. For this purpose the color masks in RGB images and color filters inserted into the optic were used. The extraction of brown stained cytoplasm was performed with blue filter and of brown stained cytoplasm was performed with blue filter and blue mask (the supplemented color for DAB dye), and the extraction of blue stained nuclei was performed with orange filter and red mask (the supplemented color for hematoxylin dye). The upper cut-off luminance level of DAB stained cytoplasm (for extraction of lumina or intercellular space) was fixed according to the reference densitometric value of red cells. Small manual corrections sometimes were needed. The shapes of nuclei and the shapes of lumina and intercellular spaces were cut from the image of DAB staining. The densitometric values of immunohistochemical expression of AT1 or AT2 receptor proteins were measured in extracted areas of the originally recorded image. The integrated optical density of red cells (i.e. mean graylevel of one pixel) were divided by the integrated optical density of the measured structure. The maximal brightness (i.e. lack of DAB staining) was 255 graylevels, the minimal was 0 (theoretically maximal intensive DAB staining). Thus, a higher relative value indicates a more intense DAB expression. The results are presented as relative values according to the original primary histological grading in every field, not according to the total sum for every case (i.e. to the total Gleason score).
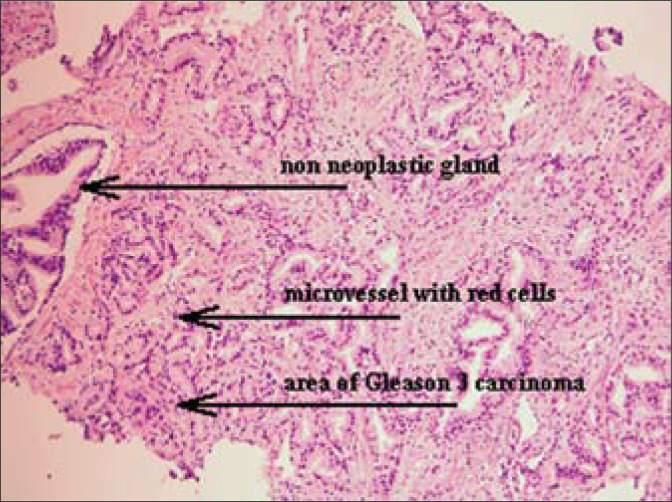
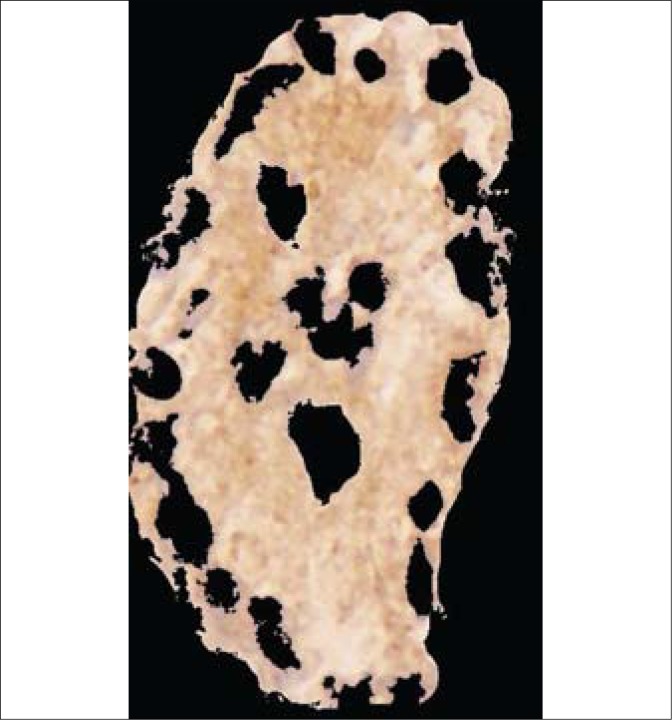
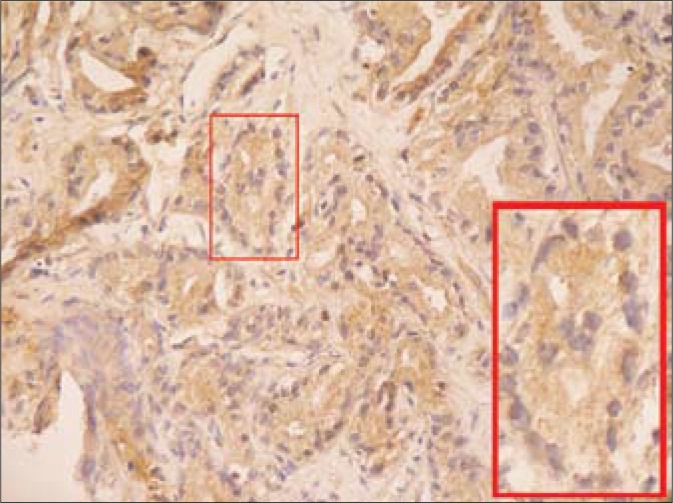
The statistic analysis was performed using Statistica ver. 5.0 software. After the F-Snedecor test for variance equality, the appropriate double-sided t-Student test was used for estimating the statistic significance of differences of densitometric values of various types of glands (p <0.05). Moreover, the Pearson correlation coefficient r was calculated. The correlation between densitometric values of glands in the same areas stained with AT1 and AT2 antibodies was analyzed. The steps of the image analysis are presented below (Figs. 1–3).
Fig. 1.
An assessment image of a Gleason 3 carcinomatous infiltration (H&E, magn. 50x).
Fig. 3.
The resulting image for densitometric measurement of DAB expressions in the carcinomatous tubule from Fig. 2.
Fig. 2.
The compatible image with AT1 immunohistochemical reaction in carcinomatous infiltration (DAB, 100x; insert: the magnified carcinomatous tubule, 400x).
RESULTS
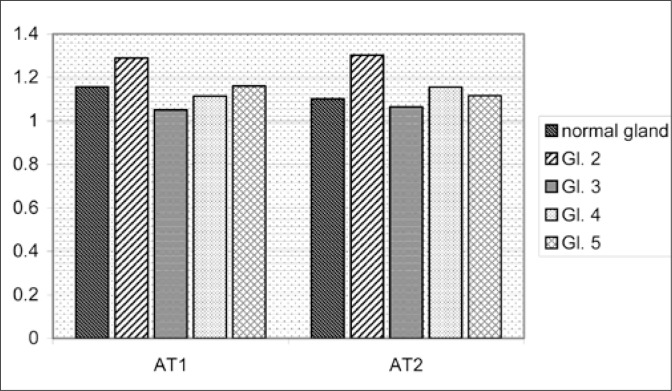
The positive immunostaining with both anti-AT1 and anti-AT2 antibodies can be found in stromal as well as epithelial structures. The results of quantitative evaluation of the AT1 and AT2 immunostaining of non-neoplastic and neoplastic tubules or solid neoplastic cell infiltrations are presented on Fig 4. As can be seen there, the immunostaining intensity with both anti-AT1 and anti- AT2 antibodies was increased in neoplastic epithelium of Gleason grade 2. However, in cancerous structures of Gleason 3-5 grades, the immunopositivity of both receptor proteins was roughly similar to that measured in normal prostatic epithelium.
Fig. 4.
The densitometric ratio of DAB reaction intensity of red cell and normal or neoplastic epithelium.
The statistical analysis shows that densitometric values of the AT1 receptor staining in Gleason 2 glands differs significantly when compared to normal glandular epithelium (p = 0.029), which are also significantly higher in comparison to Gleason 3 cancers (p = 0.012). Similarly, AT2 expression in Gleason 2 differs significantly from that in normal epithelium (p = 0.031) and from Gleason 3 cancers (p = 0.027). The remaining differences were not significant, although relatively close to statistical significance. The linear regression coefficient (Pearson's r) was near statistically significant for AT1 and AT2 in all cancer glands measured at the same regions (r = +0.43), but was not significant for normal glands (p = –0.05).
DISCUSSION
The quantitative approach in immunochemistry is not performed in routine examination of biopsy specimens. The intensity of immunostaining is estimated by visual perception, then can by graded or classified as positive or negative (sometimes called as semiquantitative analysis). The basic elements of the visual scoring in so called the immunoreactive score (IRS) are the percentage of positive cells (PP) and the staining intensity (SI) [12] as well as the intracellular localization of chromogen (nuclear, membranous or cytoplasmatic). The essential arguments against routine quantitative analysis of immunohistochemistry are inability for standardization and time-consuming procedure. Immunohistochemical localization of a protein in routinely fixed and processed clinical specimens is affected by numerous preanalytical factors; the standardization of which is inordinately difficult, if not outright impossible. The multitude of factors that in one way or another impact the immunohistochemical results are related to the nature of tissue itself and the way it is handled from the time of surgical excision to immunohistochemical staining [13].
However, it is not true to the end. The strict usage of immunostaining protocols and image analysis procedures enable precise determination of DAB amount expressed in standard paraffinembedded specimens, which is useful in comparative analysis [14]. Moreover, image analysis systems are widely performed for HER2 and other antigens quantitative evaluation [15, 16]. This approach is especially useful when the problem is not to state the existence of antigen in tissue, but measure the quantity of existing antigen. Like it was proved in the PDX-1 antigen quantification study (a transcription factor overexpressed in the cytoplasm of prostate cancer cells), intra- and interobserver variability of visual estimation of staining intensity in cells is very small (mean kappa 0.85), but the agreement of estimating of extent (percentage) of immunopositive cells (in fourlevel scale) was not satisfactory (mean kappa 0.43). In this study both visual perception and densitometric measurement of chromogen expression were performed [17]. Of course, the intensity of chromogen is not directly proportional to the amount of antigen, due to non-stechiometric character of immunohistochemical reaction. In our study we decided to use described above specific procedures minimizing the influence of laboratory procedures on evaluation results. We used also an internal peroxidase-activity blocking control (DAB expression of erythrocyte), which prevents the most important mistake in immunoquantification, and the results are presented as relative values compared to the intensity of erythrocytes staining.
Our study confirms that both AT1 and AT2 receptors are detectable by immunohistochemistry in human prostate cancer samples and are located in interstitium, non-neoplastic and neoplastic cells. The quantitative evaluation shows, that at Gleason 2 grade, the expression of both AT1and AT2 is higher in neoplastic in comparison to non-neoplastic cells, what corroborates with the observation done by Uemura et al. who found that AT1 mRNA is over-expressed in malignant as compared to normal prostatic tissues [6]. The cause of that over-expression remains unclear, but a recent study showed that in vitro exposure of prostatic cancer cells LNCaP and DU-145 to angiotensin II resulted in an enhanced expression of AT1 and AT2 mRNAs [18]. This remains in opposition to the situation observed in benign prostatic hyperplasia, where the increased angiotensin level leads to the down-regulation of AT1 receptors [5]. The same phenomenon may be a cause of positive correlation of AT1 and AT2 expressions in cancer cells. In our material, the over-expression of AT1 receptors is limited only to Gleason 2 grade. In samples of Gleason 3-5 grade, the immunostaining intensities of AT1 and AT2 did not differ between neoplastic and non-neoplastic cells. This observation seems compatible with finding of Uemura et al. [11] showing the higher expression of AT1 in well differentiated than in poorly-differentiated prostate cancers. Similar observations were also done in other neoplasms. AT1 expression is increased in highly differentiated, but not in poorly differentiated laryngeal cancers [19]. In adrenal tumors, AT1 expression is preserved or even increased in benign adenomas, but decreased in adrenal cancers [20]. The pattern of AT2 immunostaining in prostate cancer samples is identical as that of AT1, namely, the AT2 immunopositivity is enhanced at Gleason 2 grade but similar to the control at higher grades of malignancy.
CONCLUSIONS
The over-expression of AT1 and AT2 receptors in highly differentiated prostate cancer and positive correlation between AT1 and AT2 expressions observed in cancerous epithelium suggest the involvement of angiotensin receptors in prostate cancerogenesis. Moreover, the persistence of AT1 receptors in prostate cancer speaks in favor of attempts to use of AT1 receptor blockers (i.e. sartanes) in prostate cancer prophylaxis or treatment [11, 21]. Since, in contrast to AT1, the AT2 receptors are connected with antiproliferative and pro-apoptotic activities, the presence of the latter in prostate cancers may suggest the possibility of future application of AT2 agonists in the treatment of this cancer [8, 10]. Our study also indicates the usefulness of the applied quantitative approach in evaluation of immunohistochemical staining in histopathological material [22].
REFERENCES
- 1.O'Mahony OA, Barker S, Puddefoot JR, Vinson GP. Synthesis and secretion of angiotensin II by the prostate gland in vitro. Endocrinology. 2005;146:392–398. doi: 10.1210/en.2004-0565. [DOI] [PubMed] [Google Scholar]
- 2.Dinh DT, Frauman AG, Sourial M, et al. Identification, distribution, and expression of angiotensin II receptors in the normal human prostate and benign prostatic hyperplasia. Endocrinology. 2001;142:1349–1356. doi: 10.1210/endo.142.3.8020. [DOI] [PubMed] [Google Scholar]
- 3.Pawlikowski M, Melen-Mucha G, Mucha S. The involvement of angiotensins in the control of prostatic epithelial cell proliferation in the rat. Folia Histochem Cytobiol. 2001;39:341–343. [PubMed] [Google Scholar]
- 4.Nassis I, Frauman AG, Ohishi M, et al. Localization of angiotensin-converting enzyme in human prostate: pathological expression in benign prostatic hyperplasia. J Pathol. 2001;195:571–579. doi: 10.1002/path.999. [DOI] [PubMed] [Google Scholar]
- 5.Dinh DT, Frauman AG, Somers GR, et al. Evidence for activation of the reninangiotensin system in the human prostate: increased angiotensin II and reduced AT(1) receptor expression in benign prostatic hyperplasia. J Pathol. 2002;196:213–219. doi: 10.1002/path.1021. [DOI] [PubMed] [Google Scholar]
- 6.Uemura H, Ishiguro H, Naigakawa N, et al. Angiotensin II receptor blocker shows antiproliferative activity in prostate cancer cells: a possibility of tyrosine kinase inhibitor of growth factor. Mol Cancer Ther. 2003;2:1139–1147. [PubMed] [Google Scholar]
- 7.Ławnicka H, Potocka AM, Juzala A, et al. Angiotensins II and its fragments (angiotensins III and IV) decrease the growth of DU-145 prostate cancer cells in vitro. Med Sci Mon. 2004;10:BR1–BR4. [PubMed] [Google Scholar]
- 8.Chow L, Rezmann L, Imamura K, et al. Functional angiotensin II type 2 receptors inhibit growth factor signaling in LNCaP and PC3 prostate cell lines. Prostate. 2008;68:651–660. doi: 10.1002/pros.20738. [DOI] [PubMed] [Google Scholar]
- 9.Sidorkiewicz M, Rebas E, Szymajda M, et al. Angiotensin receptors in hormone-dependent prostate cell line DU145: presence of two variants of angiotensin type 1 receptor. Med Sci Mon. 2009;15:BR106–110. [PubMed] [Google Scholar]
- 10.Carmel M, Guimond MO, Battista MC, et al. Role of angiotensin II receptors in prostate cance, Program. J Urol. 2009;181(suppl):1330. abstr. [Google Scholar]
- 11.Uemura H, Hasumi H, Kawashara T, et al. Pilot study of angiotensin II receptor blocker in advanced hormone-refractory prostate cancer. Int J Clin Oncol. 2005;10:405–410. doi: 10.1007/s10147-005-0520-y. [DOI] [PubMed] [Google Scholar]
- 12.Umemura S, Kurosumi M, Moriya T, et al. Immunohistochemical evaluation for hormone receptors in breast cancer: a practically useful evaluation system and handling protocol. Breast Cancer. 2006;13:232–235. doi: 10.2325/jbcs.13.232. [DOI] [PubMed] [Google Scholar]
- 13.Nadji M. Quantitative Immunohistochemistry of Estrogen Receptor in Breast Cancer. Much Ado About Nothing! Appl Immunohistochem Mol Morphol. 2008;16:105. doi: 10.1097/PAI.0b013e3181607323. [DOI] [PubMed] [Google Scholar]
- 14.Atkins SR, Turesson C, Myers JL, et al. Morphologic and quantitative assessment of CD20+ B cell infiltrates in rheumatoid arthritis-associated nonspecific interstitial pneumonia and usual interstitial pneumonia. Arthritis Rheum. 2006;54:635–641. doi: 10.1002/art.21758. [DOI] [PubMed] [Google Scholar]
- 15.Hanley KZ, Siddiqui MT, Lawson D, et al. Evaluation of new monoclonal antibodies in detection of estrogen receptor, progesterone receptor, and Her2 protein expression in breast carcinoma cell block sections using conventional microscopy and quantitative image analysis. Diagnostic Cytopathology. 2009;37:251–257. doi: 10.1002/dc.20989. [DOI] [PubMed] [Google Scholar]
- 16.Parker AS, Lohse CM, Leibovich BC, et al. Comparison of digital image analysis versus visual assessment to assess survivin expression as an independent predictor of survival for patients with clear cell renal cell carcinoma. Hum Pathol. 2008;39:1176–1184. doi: 10.1016/j.humpath.2007.12.009. [DOI] [PMC free article] [PubMed] [Google Scholar]
- 17.Jonmarker Jaraj S, Camparo P, Boyle H, et al. Intra- and interobserver reproducibility of interpretation of immunohistochemical stains of prostate cancer. Virchows Arch. 2009;455:375–381. doi: 10.1007/s00428-009-0833-8. [DOI] [PubMed] [Google Scholar]
- 18.Domińska K. Effect of peptides from angiotensin family on tyrosine kinase activity and cell proliferation of hormone-dependent and hormone – independent prostate cancer (in Polish); Medical University of Lodz; 2009. (thesis) [PubMed] [Google Scholar]
- 19.Marsigliante S, Resta L, Muscella A, et al. AT1 angiotensin II receptor subtype in the human larynx and squamous laryngeal carcinoma. Cancer Lett. 1996;110:19–27. doi: 10.1016/s0304-3835(96)04449-7. [DOI] [PubMed] [Google Scholar]
- 20.Pawlikowski M, Winczyk K, Śledź B. Immunohistochemical detection of angiotensin receptors AT1 and AT2 in adrenal tumors. Folia Histochem Cytobiol. 2008;46:51–55. doi: 10.2478/v10042-008-0006-7. [DOI] [PubMed] [Google Scholar]
- 21.Kosaka T, Miyajima A, Takayama E, et al. Angiotensin II type 1 receptor antagonist as an angiogenic inhibitor in prostate cancer. Prostate. 2007;67:41–49. doi: 10.1002/pros.20486. [DOI] [PubMed] [Google Scholar]
- 22.Zielinski KW, Strzelecki M. Computer assisted analysis of biomedical images. Introduction to the morphometry and quantitative pathology (in Polish) Warsaw: Polish Scientific Publishers PWN; 2002. pp. 276–283. [Google Scholar]
- 23.Epstein JI, Allsbrook WC, Jr, Amin MB, Egevad LL. ISUP Grading Committee. The 2005 International Society of Urological Pathology (ISUP) Consensus Conference on Gleason Grading of Prostatic Carcinoma. Am J Surg Pathol. 2005;29:1228–1242. doi: 10.1097/01.pas.0000173646.99337.b1. [DOI] [PubMed] [Google Scholar]


