Abstract
The renal afferent arteriole reacts to an elevation in blood pressure with an increase in muscle tone and a decrease in luminal diameter. This effect, known as the myogenic response, is believed to stabilize glomerular filtration and to protect the glomerulus from systolic blood pressure increases, especially in hypertension. To study the mechanisms underlying the myogenic response, we developed a mathematical model of intracellular Ca2+ signaling in an afferent arteriole smooth muscle cell. The model represents detailed transmembrane ionic transport, intracellular Ca2+ dynamics, the kinetics of myosin light chain phosphorylation, and the mechanical behavior of the cell. It assumes that the myogenic response is initiated by pressure-induced changes in the activity of nonselective cation channels. Our model predicts spontaneous vasomotion at physiological luminal pressures and KCl- and diltiazem-induced diameter changes comparable to experimental findings. The time-periodic oscillations stem from the dynamic exchange of Ca2+ between the cytosol and the sarcoplasmic reticulum, coupled to the stimulation of Ca2+-activated potassium (KCa) and chloride (ClCa) channels, and the modulation of voltage-activated L-type channels; blocking sarco/endoplasmic reticulum Ca2+ pumps, ryanodine receptors (RyR), KCa, ClCa, or L-type channels abolishes these oscillations. Our results indicate that the profile of the myogenic response is also strongly dependent on the conductance of ClCa and L-type channels, as well as the activity of plasmalemmal Ca2+ pumps. Furthermore, inhibition of KCa is not necessary to induce myogenic contraction. Lastly, our model suggests that the kinetic behavior of L-type channels results in myogenic kinetics that are substantially faster during constriction than during dilation, consistent with in vitro observations (Loutzenhiser R, Bidani A, Chilton L. Circ. Res. 90: 1316–1324, 2002).
Keywords: renal microcirculation, smooth muscle mechanics, myogenic tone, calcium transport
the afferent arteriole (AA) of the rat kidney exhibits the myogenic response, in which the vessel reacts to a transmural pressure elevation with constriction and to a pressure reduction with dilation. In addition, the AA exhibits spontaneous oscillations in vascular tone, with a period of ∼10 s under normotensive conditions (6). The pressure-induced response and spontaneous vasomotion, which have been demonstrated in other arterioles, as well as in some arteries, venules, veins, and lymphatics (28), are independent of neural, metabolic, and hormonal influences. The myogenic response is thought to play an essential role in the maintenance of constant blood flow and capillary hydrostatic pressure when systemic arterial pressure varies. The contractile myogenic response is believed to be initiated by a depolarization of the vascular smooth muscle cell, which then triggers calcium (Ca2+) entry through voltage-gated Ca2+ channels (39); the prevailing thought is that the initial membrane depolarization is caused by an increase in the open probability of nonselective, pressure-activated cation channels. Other transporters and signaling pathways may also contribute to the response, such as voltage- and calcium-gated potassium channels and calcium trafficking between the cytosol and the sarcoplasmic reticulum (SR), including the release of Ca2+ by ryanodine receptors (RyR) and inositol triphosphate receptors (IP3R). A notable feature of the AA myogenic mechanism is the asymmetry in its response times for vasoconstriction and vasodilation. Loutzenhiser and coworkers (34, 35) observed that the initial delay in the activation of pressure-dependent vasoconstriction was ∼0.3 s, with the time profile of the response approximated by an exponential having a time constant of 4 s. In contrast, vasodilation was initiated after an initial delay of ∼1 s, and the response was then approximated by two exponentials having time constants of 1 and 14 s, respectively. As a result of that marked asymmetry in the kinetics of vasoconstriction and relaxation, the AA responds to pulse pressure fluctuations in blood flow with a sustained vasoconstriction that is determined by the systolic pressure (34, 35). The origin of that response time asymmetry has yet to be understood. The goal of the present study was to develop a detailed mathematical model of the myogenic response of a small segment of the AA wall, so as to elucidate the mechanisms underlying the spontaneous vasomotion and myogenic response of the arteriole. The model represents ionic transport across an AA vascular smooth muscle cell, intracellular Ca2+ dynamics, the kinetics of myosin light chain (MLC) phosphorylation, and the mechanical behavior of the cell.
MATHEMATICAL MODEL
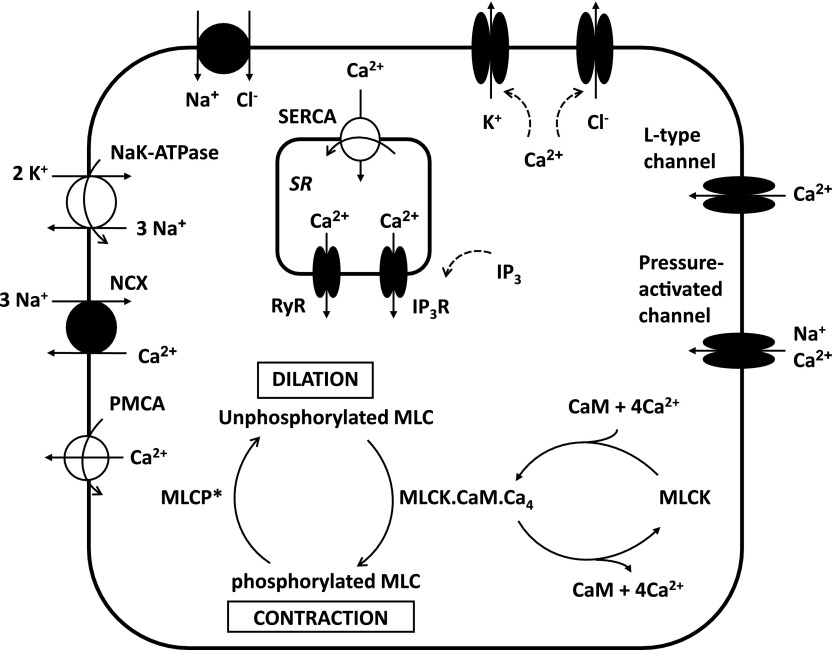
Figure 1 displays the main signaling pathways in an AA smooth muscle cell that our model accounts for. The contractile force exerted on the cell depends on the fraction of MLCs that are phosphorylated. As described further below, the phosphorylation of MLC is carried out by myosin light chain kinase (MLCK) and inhibited by myosin light chain phosphatase (MLCP). These two enzymes are in turn regulated by other agents: the activity of MLCK is dependent on the cytosolic concentrations of Ca2+ and calmodulin, and the activity of MLCP is modulated by Rho kinase. This section begins with a description of ionic currents across K+, Na+, Cl−, and Ca2+ channels. We then describe how the model accounts for the buffering of Ca2+ (in particular by calmodulin), the activation of MLCK and MLCP, and the phosphorylation of MLC. Lastly, the mechanical properties of the vessel are briefly summarized. The convention adopted in this study is that exit of positive charge from the cell is a positive current. Conversely, exit of negative charge is a negative current.
Fig. 1.
Simplified representation of a vascular smooth muscle cell in the renal afferent arteriole. Not shown are background channels, and inward- and delayed-rectifier K+ channels. The contractile force depends on the fraction of myosin light chains (MLC) that are phosphorylated. An increase in luminal pressure generates an influx of cations into the cytosol via pressure-activated channels. The subsequent increase in cytosolic Ca2+ levels enhances the formation of the MLCK.CaM.Ca4 complex, i.e., the active form of myosin light chain kinase (MLCK). As a result, the contractile force increases. MLCP, myosin light chain phosphatase; CaM, calmodulin; PMCA, plasma membrane Ca2+ pump; NCX, Na+/Ca2+ exchanger; SERCA, sarco/endoplasmic Ca2+ pump; RyR, ryanodine receptor; IP3R, inositol triphosphate (IP3) receptor.
Ion and charge conservation equations.
The cytosolic concentrations of K+, Na+, Cl−, and Ca2+ as a function of time are determined by considering the sum of their respective fluxes into the cytosol (each of which is described below) and integrating the following differential equations:
| (1) |
| (2) |
| (3) |
| (4) |
In the SR, we have:
| (5) |
where F is Faraday's constant, and volcyt, volcyt,Ca, and volSR denote the total volume of the cytosol, that which is available to Ca2+, and the volume of the SR, respectively. The reaction terms RCaMcyt, RBfcyt, and RCalseqSR account for the buffering of Ca2+ by calmodulin, other cytosolic buffers, and calsequestrin, respectively.
The net sum of the currents flowing across the plasma membrane is determined as:
| (6) |
The time dependence of the transmembrane potential (Vm) is given by:
| (7) |
where Cm is the membrane capacitance, taken as 5.5 pF (46).
Background currents.
The background current of ion i is calculated as:
| (8) |
where the Nernst potential of ion i (with valence zi) is given by:
| (9) |
R is the ideal gas constant, T is the temperature, and [i]out denotes the extracellular concentration of ion i.
Pressure-activated channels.
As discussed below, the identity of the pressure-activated channels expressed by the AA remains to be fully elucidated. We assume that these channels predominantly carry Na+ and that they are somewhat permeable to Ca2+ but not to other ions. The corresponding currents are calculated as:
| (10) |
| (11) |
where the conductance Gi,Pres to ion i (i = Na+, Ca2+) is taken to depend on the luminal pressure P as follows:
| (12) |
We assume that P1 ≡ 100 mmHg and P2 ≡ 60 mmHg.
Potassium transport pathways.
The potassium current across inward-rectifier (Kir) channels is expressed as:
| (13) |
| (14) |
The exponential factor (0.9), the potential of half-maximal activation (VKir), and the slope (sKir) were obtained by fitting Kir currents in cerebral arterial smooth muscle cells (51).
The potassium current across delayed-rectifier (Kv) channels is calculated as (52):
| (15) |
| (16) |
| (17) |
| (18) |
| (19) |
| (20) |
| (21) |
where PKv1 and PKv2 denote the two components of the channel activation process, and τKv1 and τKv2 denote the respective time constants (in ms). The variable P̄Kv, which is voltage dependent, represents the steady-state value of PKv1 and PKv2.
The current flowing across Ca2+-activated K+ (KCa) channels is calculated as (52):
| (22) |
| (23) |
| (24) |
| (25) |
| (26) |
| (27) |
where Pf and Ps denote the fast and slow components of the channel activation process, respectively, and τPf and τPs denote the corresponding time constants. The steady-state open probability of the channel is given by P̄KCa.
We do not consider ATP-dependent K+ channels in this model, assuming that their conductance is negligible in well perfused and oxygenated arterioles.
Sodium transport pathways.
The current across Na+/K+-ATPase pumps is determined as:
| (28) |
The pump affinities are taken from Refs. 37 and 53.
The current across Na+/Ca2+ (NCX) exchangers is given by (45):
| (29) |
| (30) |
| (31) |
| (32) |
| (33) |
The flux across NaCl cotransporters is expressed as (31):
| (34) |
Chloride transport pathways.
The current across Ca2+-activated Cl−(ClCa) channels is computed as (25):
| (35) |
| (36) |
| (37) |
where P̄ClCa denotes the steady-state open probability of the channel.
Calcium transport pathways.
The current through plasmalemmal Ca2+ (PMCA) pumps is expressed as:
| (38) |
The affinity of the pump for Ca2+ (Km,PMCACa) is taken as 170 × 10−6 mM (15).
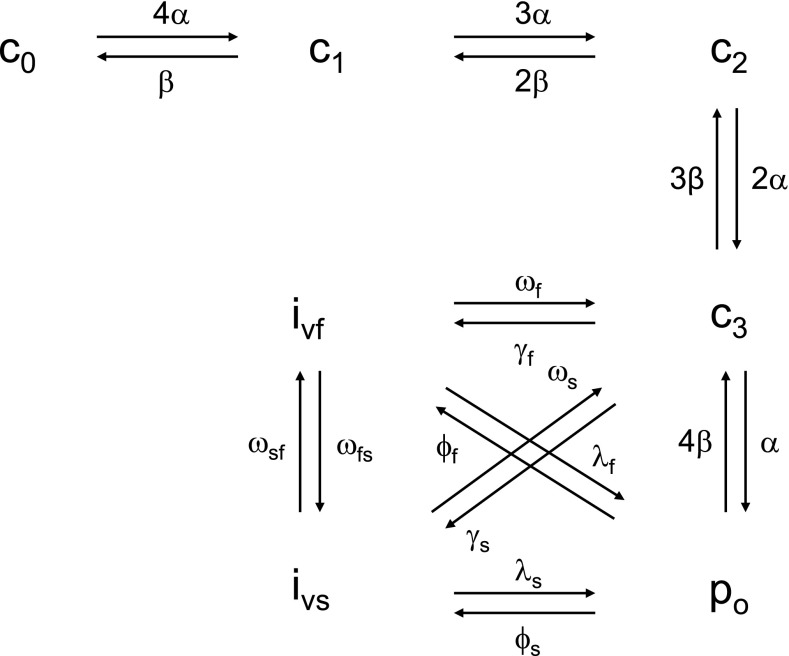
In the renal AA, the current across L-type Ca2+ channels (CaV1.2) exhibits a threshold around −30 mV and peaks around +10 mV (46). The CaV1.2 model of Faber et al. (11), shown in Fig. 2, reproduces these characteristics and is thus used here. We consider only the voltage-dependent gating mode of the channel, which includes four closed states (c0, c1, c2, and c3), one open state (po), and fast (ivf) and slow (ivs) inactivated states. Accordingly, we have:
| (39) |
| (40) |
| (41) |
| (42) |
| (43) |
| (44) |
| (45) |
| (46) |
Based on the data of Smirnov et al. (46) and this model, the maximum conductance of the L-type channel is estimated as 0.5 nS/pF or 2.75 nS.
Fig. 2.
State diagram of the L-type channel, according to the model of Faber et al. (11). Since [Ca2+]cyt remains below 1 μM in our model, we do not consider the Ca2+-dependent inactivation gating mode of the channel.
AAs express not only L-type but also T-type Ca2+ channels (21). T-type Ca2+ channels (TCC) are activated after smaller membrane depolarizations, and inactivated faster and more completely, compared with L-type channels (43). However, recent (direct) measurements of Ca2+ channel activity in renal afferent and efferent myocytes suggest that there are no functional TCC in the arteriole (46). Thus we do not consider T-type Ca2+ channels in this model.
The current across sarco/endoplasmic reticulum Ca2+ (SERCA) pumps is given by:
| (47) |
The half-saturation constant (Km,PMCACa) is taken as 310 × 10−6 mM (14).
We use the RyR model of Keizer and Levine (30) to determine the RyR-mediated release current into the cytosol:
| (48) |
where νRyR is the RyR rate constant. The open probability of RyR (PRyR) is calculated as:
| (49) |
| (50) |
| (51) |
The IP3R-mediated release current in the cytosol is calculated based on the IP3R model of De Young and Keizer (8):
| (52) |
where νIP3R is the IP3R rate constant, and x110 is the fraction of receptors bound by one activating Ca2+ and one IP3 (calculated as described below). The cytosolic concentration of IP3 is given by:
| (53) |
where k+IP3 and k−IP3 are the rate constants for IP3 formation and consumption, respectively, [IP3]ref is a reference IP3 concentration, and α4 determines the strength of the Ca2+ feedback on IP3 production.
This kinetic model assumes that three equivalent and independent IP3R subunits are involved in conduction, and that each subunit has one IP3 binding site (denoted as site 1) and two Ca2+ binding sites, one for activation (site 2), the other for inhibition (site 3). The fraction of receptors in state Si1i2i3 is denoted by xi1i2i3 (ij equals 0 or 1), where the j-th binding site is occupied if ij = 1. All three subunits must be in the state S110 (corresponding to the binding of one IP3 and one activating Ca2+) for the IP3R channel to be open. Assuming rapid equilibrium for IP3 binding, we have:
| (54) |
| (55) |
If we define dk as bk/ak, the conservation equations for the fractions x0i2i3 can be written as:
| (56) |
| (57) |
| (58) |
| (59) |
Calcium buffers.
We account for the chelation of Ca2+ by calmodulin and other Ca2+-binding proteins in the cytosol and by calsequestrin in the SR. The binding of Ca2+ to calmodulin is described further below. Let [Bf]cyttot denote the total concentration of Ca2+-binding proteins other than calmodulin in the cytosol, and [Bf·Ca]cyt the concentration of the calcium-bound sites of these other buffering elements. Assuming that calcium buffering can be described as a first-order dynamic process, we have:
| (60) |
Similarly, the buffering of calcium by calsequestrin in the SR is represented as:
| (61) |
where [Calseq]SRtot denotes the total concentration of calsequestrin sites available for Ca2+ binding in the SR, and [Calseq·Ca]SR the concentration of Ca2+-bound calsequestrin sites in that compartment.
CaM activation of MLCK.
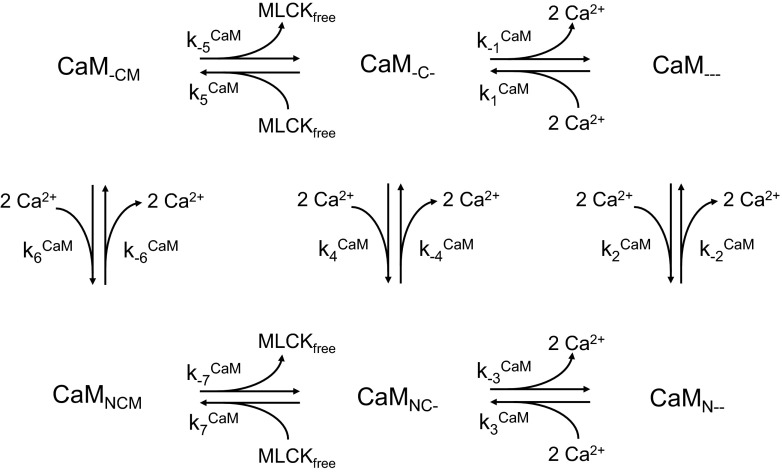
Calmodulin has four Ca2+ binding sites, two at the NH2 terminus (low affinity) and two at the COOH terminus (high affinity). Binding of Ca2+ to those sites yields the CaM.Ca4 complex. In turn, CaM.Ca4 binds to MLCK to form MLCK.CaM.Ca4, the active form of MLCK that phosphorylates MLCs. We use the scheme proposed by Fajmut et al. (12) to determine the kinetics of formation of MLCK.CaM.Ca4. In this representation, illustrated in Fig. 3, the subscripts N and C represent two binding sites each for Ca2+ at the NH2 and COOH terminus of CaM, respectively, whereas the subscript M represents the CaM binding site occupied by MLCK. An underscore (_) denotes an unoccupied state for each of these binding sites. With this notation, CaMNCM designates MLCK.CaM.Ca4. The corresponding kinetic equations are written as:
| (62) |
| (63) |
| (64) |
| (65) |
| (66) |
where the on- and off-rate constants are denoted by kiCaM and k−iCaM, respectively, and [MLCK]free represents the concentration of free (unbound) MLCK. For simplicity, we omit in these kinetic equations the subscript “cyt” that denotes the cytosolic compartment. In addition, conservation of total calmodulin ([CaM]tot) and total MLCK ([MLCK]tot) yields:
| (67) |
| (68) |
Note that the buffering terms in the Ca2+ conservation equations are given by:
| (69) |
| (70) |
| (71) |
Fig. 3.
Kinetic scheme for the formation of MLCK.CaM.Ca4, denoted CaMNCM in this representation. CaM has 4 Ca2+ binding sites, 2 at the NH2-terminus (denoted by the subscript N) and 2 at the COOH terminus (denoted by the subscript C). CaM also has one MLCK binding site (denoted by the subscript M). The MLCK.CaM.Ca4 complex phosphorylates MLCs, thereby promoting vessel contraction.
Rho-kinase inhibition of MLCP.
MLCP consists of three subunits, one of which, MYPT1, can be phosphorylated by Rho kinase (RhoK). RhoK-induced phosphorylation of MYPT1 inactivates MLCP, thereby promoting contraction. The cytosolic concentration of active MLCP (denoted MLCP*) is given by the following equation:
| (72) |
where [MLCP]tot denotes the total concentration of MLCP in the cytosol. The inactivation of MLCP by RhoK is represented as (38):
| (73) |
The concentration of RhoK is taken to be fixed at 30 nM (29), except in the presence of specific inhibitors.
MLCK- and MLCP-dependent phosphorylation of myosin.
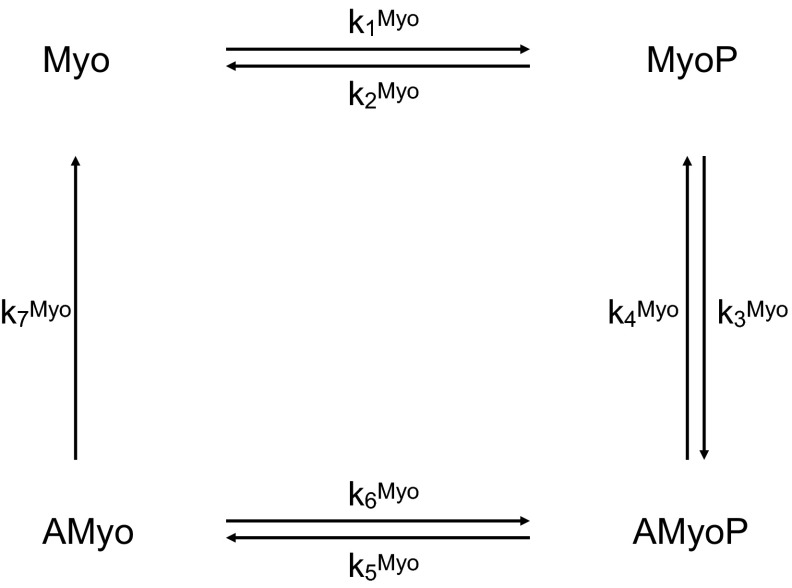
The fraction of myosin cross-bridges that are phosphorylated determines the contractile force. Four species are considered: free cross-bridges (Myo), phosphorylated cross-bridges (MyoP), attached phosphorylated, cycling cross-bridges (AMyoP), and attached dephosphorylated, noncycling cross-bridges (AMyo). The corresponding four-state kinetic model is illustrated in Fig. 4. The concentration of these MLC species is determined by solving the following set of equations:
| (74) |
| (75) |
| (76) |
| (77) |
The rate constants k3Myo, k4Myo, and k7Myo are fixed (52). The rate constants k1Myo and k6Myo represent the activity of MLCK, and are taken to be proportional to the fraction of the fully activated form of the enzyme:
| (78) |
where kMLCKMyo has a fixed value. Similarly, the rate constants k2Myo and k5Myo represent the activity of MLCP, and are calculated as:
| (79) |
where kMLCPMyo is a constant.
Fig. 4.
Kinetic scheme for the phosphorylation of myosin light chains. The unphosphorylated species Myo and AMyo are converted to the phosphorylated species MyoP and AMyoP by the active form of MLCK (i.e., MLCK.CaM.Ca4). The reverse reactions are catalyzed by the active form of myosin light chain phosphatase (i.e., MLCP*).
Vessel mechanics.
Variations in the number of crossbridges induce variations in the contractile force, which in turn give rise to variations in AA diameter. To simulate the resulting vasomotion, we adopt the model in Ref. 3 and represent the tension in the vessel wall as the sum of a passive component, Tpass, and an active myogenic component, given by the product of the maximal active tension that is generated at a given vessel circumference, Tactmax, and the fraction of MLCs that are phosphorylated, Ψ. Thus, the total tension in the wall Twall is given by:
| (80) |
The passive tension is a function of the vessel diameter D:
| (81) |
where D0 denotes the reference vessel diameter. The maximal active tension is given by:
| (82) |
The vessel diameter changes according to the difference between the tension Tpres resulting from intravascular pressure p, given by Tpres = pD/2, and the tension generated within the wall, Twall:
| (83) |
where Dc is a reference diameter, Tc is the tension value at pressure of 100 mmHg and diameter Dc, and τd is a time constant.
Parameters.
A large number of parameters are used in this model to describe the geometrical dimensions of AA, membrane transport properties, and muscle mechanical properties. The values of these parameters are given in Tables 1, 2, 3, 4, 5, 6, and 7. As discussed below, the kinetic behavior of several ionic transporters in the renal AA remains poorly characterized. When there are no AA-specific data, transport parameter values are taken from other arterial vascular smooth muscle cells.
Table 1.
Electrochemical parameters of the cell (overall)
| Parameter | Value | Unit |
|---|---|---|
| C m | 5.5 × 10⁻⁶ | μF |
| [K]out | 5.4 | mM |
| [Na]out | 140 | mM |
| [Cl]out | 120 | mM |
| [Ca]out | 2 | mM |
| F | 96,487 | C/mol |
| R | 8.341 | J·mol−1·K−1 |
| T | 298 | K |
| volcyt | 1 | pl |
| volcyt,Ca | 0.7 | pl |
| volSR | 0.14 | pl |
See mathematical model for definitions.
Table 2.
Parameters for potassium currents
| Parameter | Value | Unit |
|---|---|---|
| G K,b | 0 | nS |
| G Kir | 0.50 | nS |
| [K]ref | 5.0 | mM |
| V Kir | −80/-65 | mV* |
| s Kir | 20/5 | mV* |
| G Kv | 9.83 | nS |
| G KCa | 5.0 | nS |
| τPf | 0.5 | mS |
| τPs | 11.5 | mS |
See mathematical model for definitions.
Values for Vm below/above −60 mV
Table 3.
Parameters for sodium currents
| Parameter | Value | Unit |
|---|---|---|
| G Na,b | 0.007 | nS |
| G Na,Pres 0 | 0.020 | nS |
| I NaK,max | 3.75 | μA/μF |
| K mNaK K | 1.5 | mM |
| K m,NaK Na | 12 | mM |
| I NCX,max | 1.5 | μA/μF |
| K m,NCX Ca | 0.125 × 10⁻³ | mM |
| ksat | 0.27 | dimensionless |
| K m,Nao | 87.5 | mM |
| K m,Cao | 1.3 | mM |
| K m,Nai | 12.29 | mM |
| K m,Cai | 3.59 × 10⁻³ | mM |
| γ | 0.35 | dimensionless |
| J NaCl,max | 1.08 × 10⁻¹⁶ | mM/s |
| R NaCl | 87.825 | mV |
See mathematical model for definitions.
Table 4.
Parameters for chloride currents
| Parameter | Value | Unit |
|---|---|---|
| G Cl,b | 0.007 | nS |
| G ClCa | 0.80 | nS |
| τClCa | 0.050 | s |
| K ClCa | 140 | mM |
See mathematical model for definitions.
Table 5.
Parameters for calcium currents and buffers
| Parameter | Value | Unit |
|---|---|---|
| G Ca,b | 0.007 | nS |
| G Ca,Pres 0 | 0.003 | nS |
| G CaL | 2.75 | nS |
| I PMCA,max | 0.9 | μA/μF |
| K m,PMCA Ca | 170 × 10−6 | mM |
| I SERCA,max | 11.76 | pA |
| K m,SERCA Ca | 310 × 10−6 | mM |
| ν RyR | 12 | s−1 |
| K a | 3.7222 × 10⁻⁶ | mM |
| K b | 6.3601 × 10⁻⁶ | mM |
| K c | 0.0571 | dimensionless |
| k c − | 0.1 | s−1 |
| ν IP3R | 12 | s−1 |
| K + IP3 | 1.85 | s−1 |
| [IP3]ref | 240 | mM |
| α4 | 0.5 | dimensionless |
| k 4 | 1.1 × 10⁻³ | mM |
| k − IP3 | 1.0 | s−1 |
| a 1 | 400 × 103 | mM−1·s−1 |
| a 3 | 400 × 103 | mM−1·s−1 |
| a 4 | 0.2 × 10³ | mM−1·s−1 |
| a 5 | 20 × 103 | mM−1·s−1 |
| d 1 | 0.13 × 10⁻³ | mM |
| d 3 | 943.4 × 10⁻⁶ | mM |
| d 4 | 144.5 × 10⁻⁶ | mM |
| d 5 | 82.34 × 10⁻⁶ | mM |
| K on Bf | 103 | mM−1·s−1 |
| K off Bf | 5 | s−1 |
| [Bf]cyttot | 0.50 | mM |
| k on Calseq | 105 | mM−1·s−1 |
| k off Calseq | 65 | s−1 |
| [Calseq]SRtot | 0.14 | mM |
See mathematical model for definitions.
Table 6.
Parameters for MLCK and MLCP kinetics
| Parameter | Value | Unit |
|---|---|---|
| k 1 CaM | 2.8 × 10⁶ | mM−1·s−1 |
| k −1 CaM | 6 | s−1 |
| k 2 CaM | 108 | mM−1·s−1 |
| k −2 CaM | 800 | s−1 |
| k 3 CaM | 2.8 × 10⁶ | mM−1·s−1 |
| k −3 CaM | 6 | s−1 |
| k 4 CaM | 108 | mM−1·s−1 |
| k −4 CaM | 800 | s−1 |
| k 5 CaM | 109 | mM−1·s−1 |
| k −5 CaM | 20 | s−1 |
| k 6 CaM | 1.25 × 10⁷ | mM−1·s−1 |
| k −6 CaM | 5 | s−1 |
| k 7 CaM | 109 | mM−1·s−1 |
| k −7 CaM | 1 | s−1 |
| [CaM]tot | 10 × 10−3 | mM |
| [MLCK]tot | 2 × 10⁻³ | mM |
| [MLCP]tot | 2 × 10⁻³ | mM |
| [RhoK] | 30 × 10−6 | mM |
| kcat/k+MLCP | 0.33 × 10⁶ | mM−1 |
| k MLCK Myo | 0.537 | s−1 |
| k MLCP Myo | 1.62 | s−1 |
| k 3 Myo | 1.8 | s−1 |
| k 4 Myo | 0.1 | s−1 |
| k 7 Myo | 0.045 | s−1 |
| [Myo]tot | 30 × 10−3 | mM |
See mathematical model for definitions.
Table 7.
Smooth muscle cell mechanical parameters
| Parameter | Value | Unit |
|---|---|---|
| C pass | 223 | dyn/cm |
| C pass ′ | 20.2 | |
| C act | 500 | dyn/cm |
| C act ′ | 0.985 | |
| C act ′′ | 0.500 | |
| D 0 | 27.5 | μm |
| D c | 20.0 | μm |
| τd | 1.71 | s |
See mathematical model for definitions.
MODEL RESULTS
Spontaneous vasomotion.
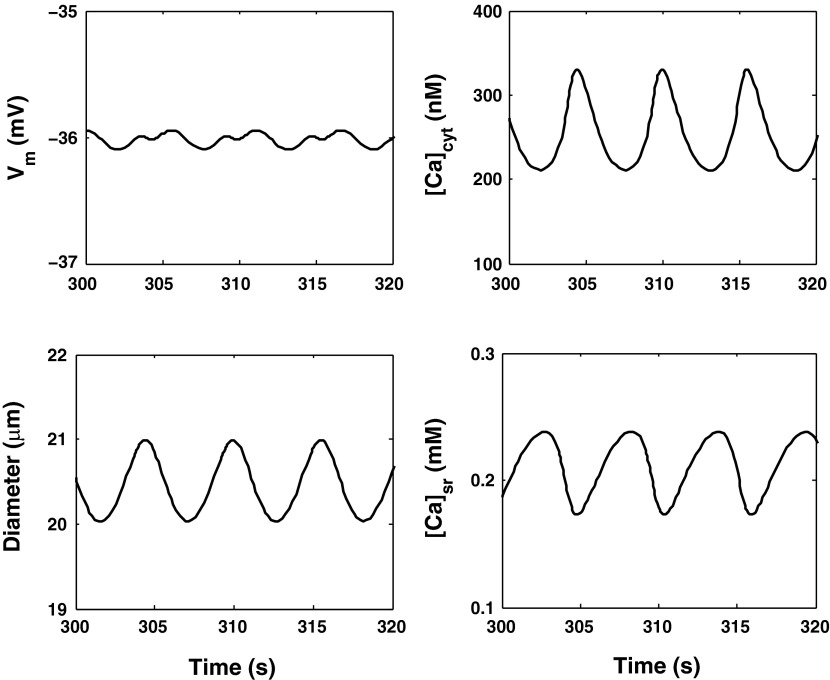
We first validated the model by comparing its predictions with experimental results. In the base case, the luminal pressure is set to 100 mmHg. As depicted in Fig. 5, the model predicts limit-cycle oscillations (LCO), i.e., spontaneous vasomotion. The cytosolic concentration of Ca2+ (denoted [Ca2+]cyt below) varies between 210 and 330 nM, with a frequency of 180 mHz, i.e., within the experimental range of 100–200 mHz (6). The mean value of the transmembrane potential (Vm) is predicted as −36 mV, in good agreement with measured values (approximately −40 mV) in pressurized AA (36). The average AA luminal radius is 20.5 μm, with an oscillation amplitude of ∼1 μm.
Fig. 5.
Predicted transmembrane potential (Vm), vessel diameter, and Ca2+ concentration in the cytosol ([Ca2+]cyt) and the sarcoplasmic reticulum ([Ca2+]sr) with a constant luminal pressure of 100 mmHg.
The LCO involve the following interplay between the cytosol and the SR: as [Ca2+]cyt rises, the rate of Ca2+ uptake into the SR via SERCA pumps is augmented, which subsequently reduces cytosolic Ca2+ levels while filling SR Ca2+ stores (Fig. 5). This in turn stimulates RyR- and IP3R-mediated Ca2+ release into the cytosol, thereby raising [Ca2+]cyt anew and depleting SR Ca2+ stores. The cycle resumes, giving rise to oscillations.
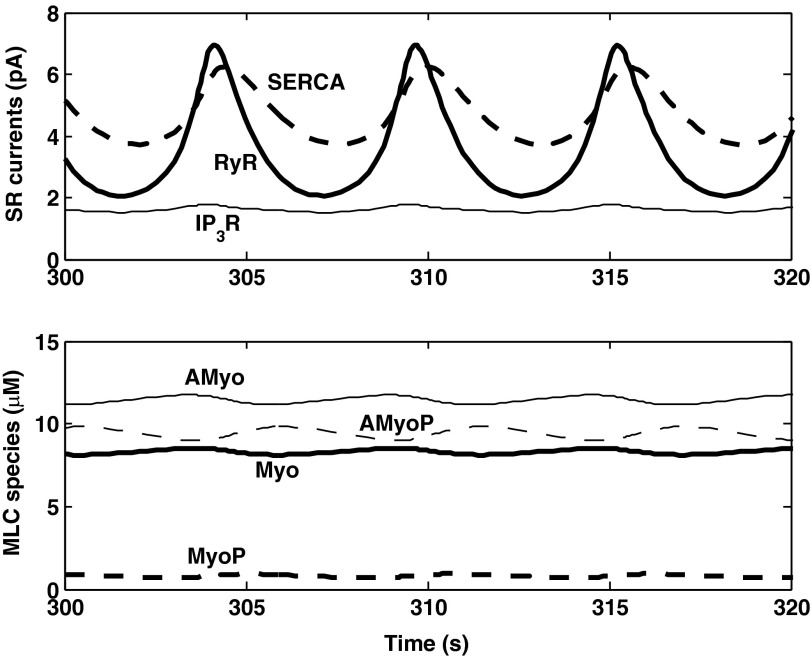
RyR-mediated calcium-induced calcium-release (CICR) plays an important part in this process. During the phase when [Ca2+]cyt rises, the open probability of RyR increases in concert, thereby enhancing the depletion of SR Ca2+ stores and the concomitant elevation of [Ca2+]cyt. This in turn raises the rate of Ca2+ pumping into the SR, such that cytosolic Ca2+ levels subsequently drop. CICR thus acts to amplify the magnitude of [Ca2+]cyt and [Ca2+]sr variations. Note that CICR can occur because the open probability of RyR is exquisitely sensitive to [Ca2+]cyt; at 100 mmHg, as [Ca2+]cyt oscillates between 210 and 330 nM, IRyR varies between 2.1 and 6.9 pA, as shown in Fig. 6. In contrast, IP3R are inhibited by high Ca2+ concentrations, and the IIP3R current varies over a much smaller range, from 1.5 to 1.8 pA. For these reasons, the model predicts that LCO vanish when ryanodine receptors are blocked but not when IP3R are blocked.
Fig. 6.
Model predictions at a constant luminal pressure of 100 mmHg. Top: Ca2+ currents via SERCA, RyR, and IP3R. Bottom: cytosolic concentration of MLC species Myo, MyoP, AMyo, and AMyoP. The fraction of phosphorylated species oscillates between 32.5 and 35.7%.
Vasomotion is also contingent upon feedback mechanisms involving transmembrane currents. It is thought that SR-induced [Ca2+]cyt fluctuations generate periodic variations in the currents across Ca2+-activated channels (e.g., KCa and ClCa); this in turn gives rise to oscillations in the membrane potential and in Ca2+ influx via L-type channels, ultimately leading to synchronized [Ca2+]cyt oscillations along the vessel (1). In accordance with this proposed mechanism, our model predicts that inhibition of KCa, ClCa, or L-type channels abolishes spontaneous vasomotion.
Effects of inhibitors.
In vitro studies have shown that L-type channel blockers induce AA dilation. In kidneys perfused at 100 mmHg, a 27% increase in AA diameter was observed in response to the blocker diltiazem (13). Our model predicts a similar (31%) increase in AA diameter, from 20.5 to 26.8 μm, when the L-type channel conductance is set to zero. RhoK, which is activated by the GTP-binding protein RhoA, inhibits MLCP and thereby stimulates the phosphorylation of MLCs. Several studies have shown that inhibition of RhoK blunts the vasoconstriction of the AA. Inscho et al. (24) found that addition of the RhoK inhibitor Y-27632, at a concentration of 0.1, 1.0, and 10 μM, resulted in a diameter increase of 10, 22, and 43%, respectively. Other investigators reported smaller vasodilatory effects: a 22% diameter increase in the presence of 10 μM Y-27632 (40) and a 22–35% increase in the presence of 100 μM Y-27632 (4). The dynamic regulation of MLCP by RhoK remains to be fully characterized, and our model thus assumes simple kinetics (Eqs. 72 and 73). Based on an EC50 value of 0.8 μM (4), our model predicts that Y-27632, respectively, raises the AA diameter by 12, 27, 31, and 32% at a concentration of 0.1, 1.0, 10, and 100 μM, in good agreement with experimental findings. Finally, we simulated the effects of increasing extracellular KCl from 5.4 to 100 mM. The average luminal diameter then decreased very significantly (from 20.5 to 7.2 μm), as observed in vitro (21).
Sensitivity analysis.
The conductance (or maximum current) of several classes of Ca2+ channels and pumps in AA smooth muscle cells has not been measured, to our knowledge. In this study, the value of these parameters was taken from measurements in other vascular smooth muscle cells or adjusted so as to fit experimental data. To assess the impact of parameter values on model predictions, we conducted a sensitivity analysis, summarized in Table 8. We found that parameter changes that significantly lower the influx of Ca2+ from the surrounding medium into the cytosol (i.e., a decrease in channel conductance or an increase in the pumping rate of PMCA) reduce both the oscillation frequency and the average value of [Ca2+]cyt. Conversely, parameter changes that augment the influx of Ca2+ raise the average [Ca2+]cyt but may also abolish LCO.
Table 8.
Sensitivity analysis, results for steady pressure (100 mmHg)
| LCO | [Cacyt] amplitude, nM | Frequency, mHz | [Cacyt], nM | Vm, mV | Diameter, μm | |
|---|---|---|---|---|---|---|
| Base case | Yes | 120 | 180 | 271 | −36.0 | 20.5 |
| PMCA maximum current | ||||||
| +25% | No | N/A | N/A | 163 | −36.0 | 26.2 |
| −25% | No | N/A | N/A | 439 | −36.3 | 11.8 |
| Background Ca2+ conductance | ||||||
| +25% | No | N/A | N/A | 300 | −36.1 | 16.4 |
| −25% | Yes | 166 | 140 | 247 | −36.1 | 24.8 |
| L-type channel Ca2+ conductance | ||||||
| +25% | No | N/A | N/A | 296 | −36.1 | 16.6 |
| −25% | Yes | 163 | 150 | 249 | −36.1 | 24.6 |
| SERCA maximum current | ||||||
| +25% | Yes | 332 | 170 | 337 | −36.1 | 18.8 |
| −25% | No | N/A | N/A | 254 | −36.0 | 21.0 |
| RyR rate constant | ||||||
| +25% | Yes | 124 | 200 | 272 | −36.0 | 20.5 |
| −25% | Yes | 58 | 170 | 259 | −36.0 | 20.9 |
| IP3R conductivity | ||||||
| +25% | No | N/A | N/A | 254 | −36.0 | 21.0 |
| −25% | Yes | 273 | 170 | 316 | −36.0 | 19.2 |
| Concentration of calmodulin | ||||||
| +25% | Yes | 108 | 180 | 268 | −36.0 | 20.6 |
| −25% | Yes | 131 | 190 | 274 | −36.0 | 20.4 |
| Concentration of other cytosolic Ca2+ buffers | ||||||
| +25% | No | N/A | N/A | 254 | −36.0 | 21.0 |
| −25% | Yes | 286 | 190 | 323 | −36.0 | 19.1 |
| ClCa conductance | ||||||
| +25% | Yes | 105 | 180 | 273 | −35.9 | 19.7 |
| −25% | Yes | 147 | 170 | 263 | −36.5 | 22.8 |
| KCa conductance | ||||||
| +25% | Yes | 130 | 170 | 269 | −36.2 | 21.2 |
| −25% | Yes | 106 | 190 | 272 | −35.8 | 19.8 |
In the presence of limit-cycle oscillations (LCO), [Cacyt], Vm, and diameter values correspond to the average over 1 period.
To understand the effects of varying SR-related parameters, note first that RyR- and IP3R-mediated [Ca2+] currents are proportional to [Ca2+]sr (Eqs. 48 and 52). Thus a steep decrease in [Ca2+]sr reduces receptor-mediated Ca2+ release into the cytosol, which reduces [Ca2+]cyt and subsequently lowers the rate of Ca2+ pumping into the SR, which further decreases [Ca2+]sr, and so on. For this reason, if we reduce the maximum SERCA current by 25%, or increase the IP3R rate constant by 25%, LCO disappear.
However, an increase in the RyR rate constant, instead of abolishing oscillations, augments their frequency. As described above, RyR mediate CICR and thus act to enhance [Ca2+]cyt variations, whereas IP3R are inhibited by cytosolic Ca2+ levels above ∼200 nM and therefore have a dampening effect. As expected given the modulating effect of KCa and ClCa channels on the membrane potential, changes in the KCa or ClCa conductance also affect the frequency and amplitude of [Ca2+]cyt oscillations (Table 8).
Myogenic response.
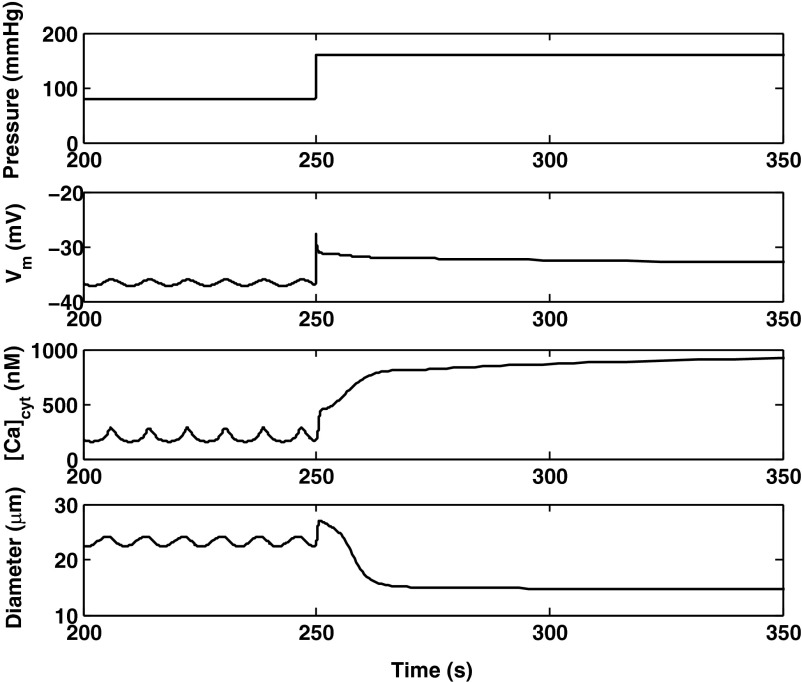
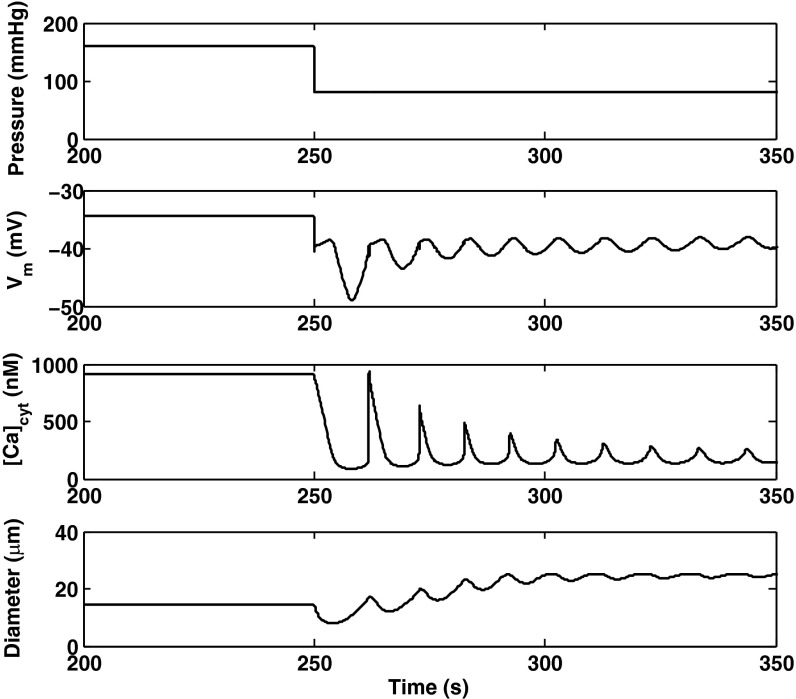
The predicted responses of the AA to a pressure up-step from 80 to 160 mmHg, and to a pressure down-step from 160 to 80 mmHg, are shown in Figs. 7 and 8, respectively. Active constriction (or vasodilation) is preceded by a passive response, as the arteriole first behaves like a compliant tube and dilates as the pressure increases (or vice versa).
Fig. 7.
Predicted Vm, [Ca2+]cyt, and vessel diameter following a pressure up-step from 80 to 160 mmHg at 250 s.
Fig. 8.
Predicted Vm, [Ca2+]cyt and vessel diameter following a pressure down-step from 160 to 80 mmHg at 250 s.
Immediately after the pressure up-step, the opening of pressure-activated channels triggers an influx of cations and a rapid depolarization. The Vm increase then activates voltage-gated Ca2+ channels, thereby further elevating [Ca2+]cyt. The latter in turn stimulates SERCA pumps and RyR-mediated Ca2+ release. After increasing rapidly, Vm decreases slightly before reaching a plateau value; indeed, several mechanisms exert counteracting effects. A long-lasting increase in K+ efflux via Ca2+-activated K+ (KCa) channels acts to hyperpolarize the cell. In addition, during the Vm peak phase, the difference between Vm and the chloride equilibrium potential becomes very small, which temporarily reduces Cl− efflux via Cl− channels, thereby favoring repolarization.
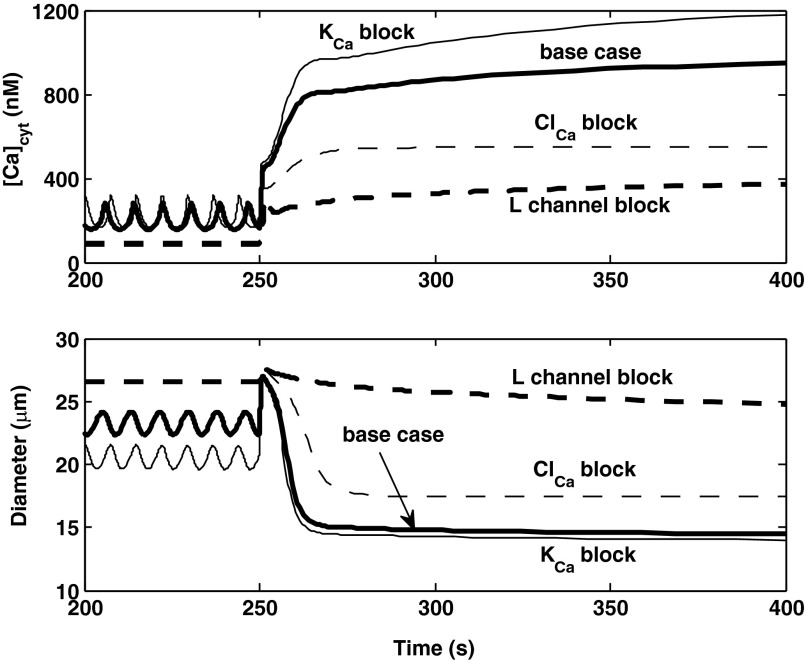
To further investigate the mechanisms underlying the AA myogenic response, we simulated the inhibition of selective channels. If L-type channels are fully blocked, both the membrane potential and [Ca2+]cyt are significantly lower at 80 mmHg, there are no oscillations, and the prestep diameter is higher (26.6 μm). Following the step increase in pressure, the [Ca2+]cyt elevation is significantly attenuated, and the myogenic response is abolished (Fig. 9), as observed experimentally (47). Similarly, if Ca2+-activated Cl− (ClCa) channels are inhibited, at 80 mmHg Vm and [Ca2+]cyt are lower than in the base case, and the vessel diameter is higher. However, the model still predicts a myogenic response, albeit with slower kinetics than in the base case (Fig. 9). Conversely, in the absence of current via KCa channels, LCO are maintained at 80 mmHg, the average values of Vm and [Ca2+]cyt are higher than in the base case, and the average prestep diameter is lower. The predicted myogenic response is then comparable to that of the base case (Fig. 9).
Fig. 9.
Predicted effects of inhibiting membrane transporters on [Ca2+]cyt and vessel diameter profiles. The pressure is raised from 80 to 160 mmHg at 250 s. Results are shown for the base case, and in the absence of current via KCa, ClCa, or L-type channels. The latter two curves cannot be distinguished prior to the pressure up-step.
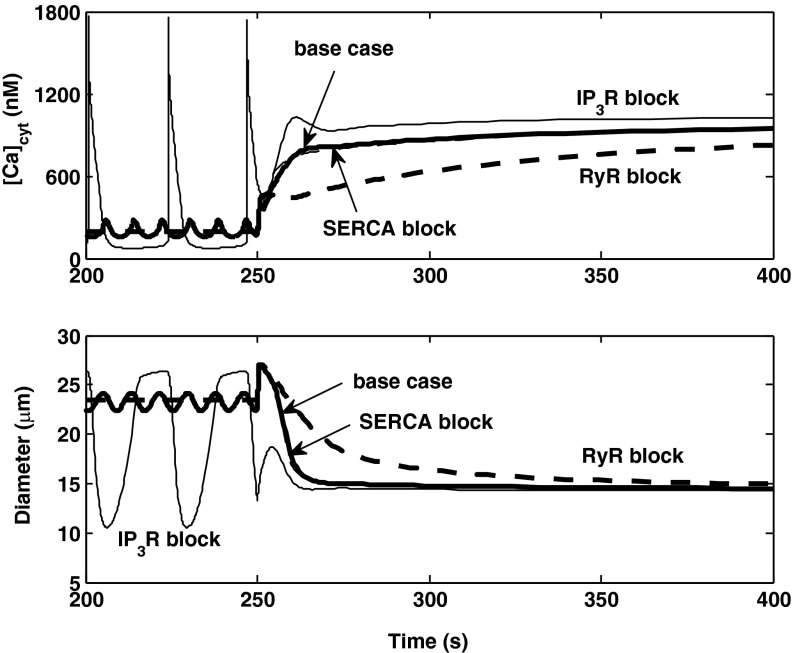
If the release of Ca2+ via RyR is blocked, there are no LCO at 80 mmHg, and [Ca2+]cyt increases more slowly following the pressure up-step. The myogenic response is thus significantly slower (∼100 s), but the AA reaches the same equilibrium diameter as in the base case (Fig. 10). Conversely, if IP3R-mediated Ca2+ release is blocked, the amplitude of [Ca2+]cyt oscillations is significantly larger at 80 mmHg, and the response is slightly faster. In the absence of SERCA-mediated Ca2+ pumping into the SR, the myogenic response differs very little from that in the base case (Fig. 10).
Fig. 10.
Predicted effects of inhibiting SERCA, RyR, or IP3R on [Ca2+]cyt and vessel diameter profiles. The pressure is raised from 80 to 160 mmHg at 250 s. The curves for the base case (thick and solid) and SERCA block (thin and dashed) can hardly be distinguished after the pressure increase.
Contribution of potassium channels.
It has been suggested that blockade of potassium channels, in particular Ca2+-activated K+ (KCa) channels, may play a role in the myogenic mechanism (7). Our model suggests that inhibition of KCa channels is not necessary to generate vasoconstriction of the AA. That is, activation of KCa channels in response to pressure-induced Ca2+ influx is not sufficient to fully hyperpolarize the smooth muscle cell and counteract the [Ca2+]cyt increase. This may be in part because the model assumes low K+ conductances, based on the relatively high experimental values of Vm in pressurized AA (see above). Our results do not, however, preclude the possibility of pressure-induced KCa channel closure. If full closure does occur upon the pressure up-step, the model predicts a slightly larger and faster myogenic response, as can be inferred from Fig. 9.
Vasodilation.
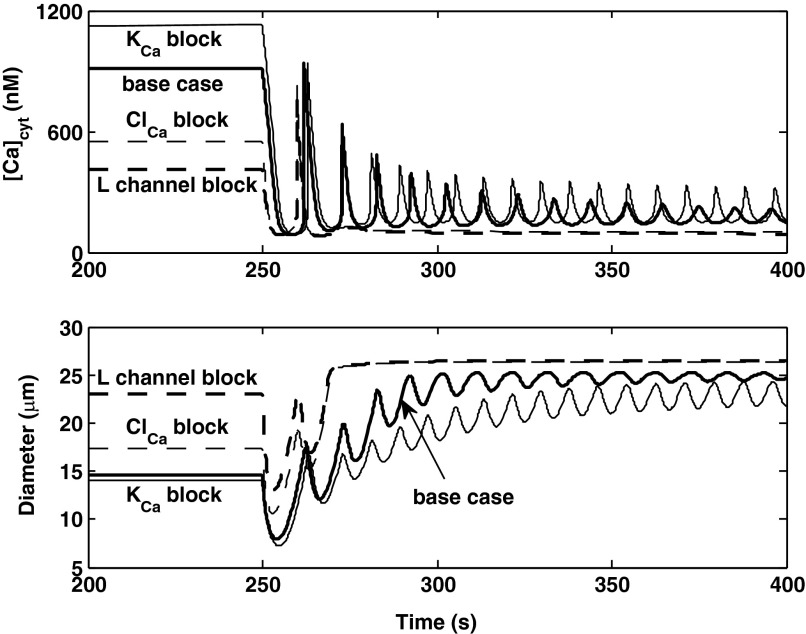
We also examined the effects of blocking selective currents on the AA response to a down-step in pressure. In the absence of inhibitors, the model predicts that a sudden reduction in cation influx via pressure-activated channels causes a drop in Vm, the subsequent closure of voltage-activated Ca2+ channels, a sharp decrease in [Ca2+]cyt followed by the onset of oscillations, and a slower rise in vessel diameter (Fig. 8). If L-type channels are inhibited, [Ca2+]cyt is significantly lower before dilation, and the myogenic response is greatly attenuated, as shown in Fig. 11. Blocking ClCa channels greatly reduces the time needed to reach equilibrium following the down-step in pressure. Indeed, in the absence of ClCa-mediated Cl− efflux, the membrane potential is predicted to drop significantly more upon the pressure decrease than in the base case, so that L-type channels close immediately.
Fig. 11.
Predicted effects of inhibiting KCa, ClCa, or L-type channels on [Ca2+]cyt and vessel diameter profiles. The pressure is lowered from 160 to 80 mmHg at 250 s.
Overall response times.
In agreement with experimental findings (35), our model predicts that the response time for vasodilation is two to three times longer than that of vasoconstriction. If we define the overall response time as the difference between the time when the pressure up (or down)-step is applied and that when the AA diameter has completed 90% of its decrease (or increase) towards its lowest (or highest) value, the response time is predicted as 15 s following a pressure up-step from 80 to 160 mmHg. Fitting the contractile response to an exponential function yields a time constant of 4.2 s, close to the experimental value of 4 s (35). Following a pressure down-step from 160 to 80 mmHg, the response time is predicted as 32 s, which is also comparable to measured values (∼25 s). The diameter profile during dilation exhibits oscillations and cannot be fitted to exponential functions.
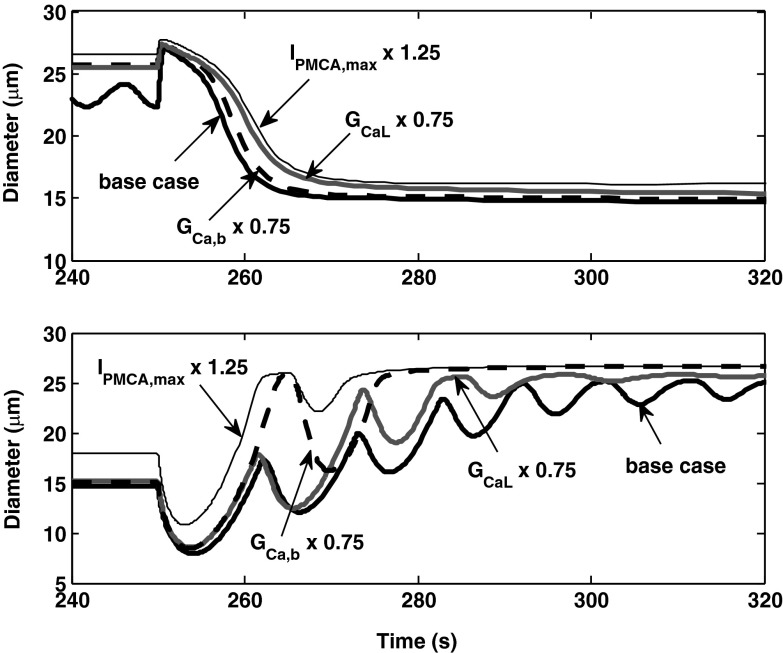
We examined the sensitivity of response times to parameter values. As shown in Fig. 12, the conductances of L-type and background Ca2+ channels, as well as the rate at which Ca2+ is pumped out the cell, have a significant impact on response times. Accelerating the rate of Ca2+ efflux, or reducing the rate of Ca2+ influx, slows down vasoconstriction and speeds up vasodilation. Note that Ca2+ transport rates into and from the SR have negligible effects (not shown).
Fig. 12.
Determinants of the response time in activating vasoconstriction (top) and dilation (bottom). A 25% increase in the maximum rate of plasma membrane Ca2+ pumps (IPMCA,max) or a 25% decrease in the conductance of L-type (GCaL) or background (GCa,b) Ca2+ channels significantly augments the rate of Ca2+ efflux from the cell and reduces [Ca2+]cyt. Hence, these changes each lengthen the contractile response time (top), and conversely shorten the dilatory response time (bottom).
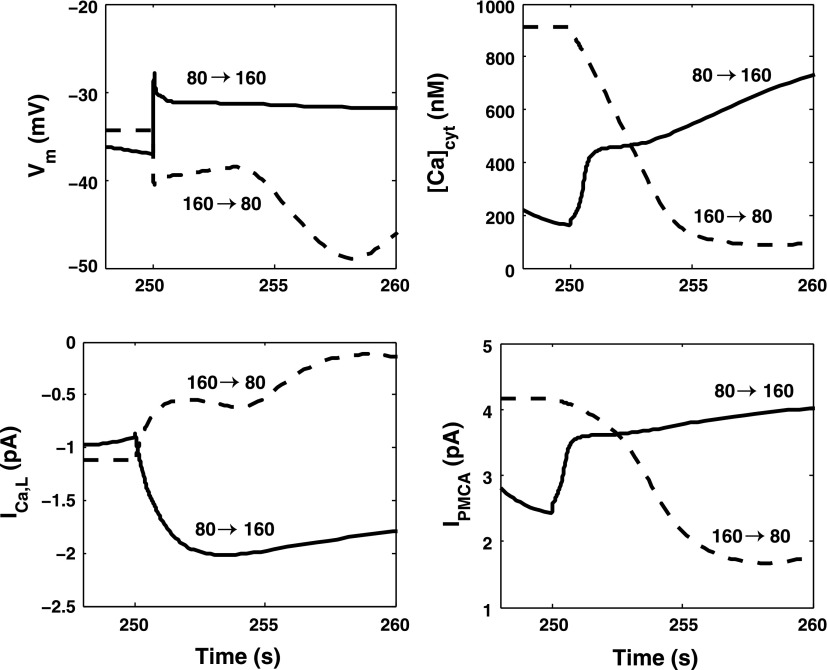
Given these findings, we examined the contribution of L-type channels and PMCA pumps to the difference in response times between constriction and dilation. As illustrated in Fig. 13, immediately following the up-step in pressure, the current across L-type channels (ICa,L) increases by 1.1 pA, whereas it decreases by 0.6 pA following the down-step in pressure. This asymmetry stems from the complex dependence of the open probability of the channel on Vm; note that the membrane potential before the up-step is not equal to that right after the down-step, and vice versa. The larger the variation in ICa,L is, the more rapid is the change in [Ca2+]cyt, and the faster is the overall response time. If ICa,L were maintained at its prestep value of −0.9 pA, the predicted response time for constriction would increase from 15 to approximately 70 s.
Fig. 13.
Predicted variations in Vm, [Ca2+]cyt, the L-type channel current (ICa,L), and the plasma membrane Ca2+ pump current (IPMCA) just before and after an 80-mmHg increase (80 →160) and decrease (160 → 80) in luminal pressure at 250 s.
The PMCA current also exhibits an asymmetry. The pump affinity for Ca2+ is taken at 170 nM, so that the pumps are nearly saturated at 160 mmHg but not at 80 mmHg. The rate at which Ca2+ is pumped out of the cell after a pressure increase differs markedly from that after a pressure decrease (Fig. 13). The effects of PMCA are difficult to isolate, however, since small changes in pump properties (or maintaining a fixed PMCA current) can lead to very high values of [Ca2+]cyt or to intracellular Ca2+ depletion.
Initial time delays.
Loutzenhiser et al. (35) estimated the initial delay in activating AA vasoconstriction as ∼0.3 s when the luminal pressure was raised from 80 to 160 mmHg. If we define the initial delay as the lag between the time when the pressure is increased and that when the luminal diameter starts to decrease, our model prediction is higher, ∼0.7 s.
The initial delay in myogenic activation is thought to reflect the time needed for Ca2+ binding to calmodulin (CaM), the ensuing activation of MLCK, and the subsequent increase in phosphorylated MLC (35). In our model, the fraction of phosphorylated MLC begins to rise ∼0.1 s after the current across pressure-activated channels is increased, and the initial delay predominantly reflects the competition between two types of mechanical forces. Vascular diameter is determined by the balance between the pressure-induced tension and the tension within the vessel wall, Tpres and Twall; vasoconstriction commences when Twall (which is approximately equal to Tpass when the myogenic force ΨTactmax is small) exceeds Tpres (see Eq. 83). When the pressure is suddenly raised from 80 to 160 mmHg, the model predicts that it takes ∼0.7 s for the total tension in the vessel wall to overcome pressure-induced tension.
The initial delay in activating AA vasodilation has been reported as ∼1 s, following a pressure down-step from 160 to 80 mmHg (35). Our model predicts a larger delay, on the order of 4 s. It is difficult, however, to isolate the effects of the pressure step in the presence of LCO, as [Ca2+]cyt and the vessel diameter begin to oscillate as soon as the pressure is lowered.
The 10-mmHg pressure steps.
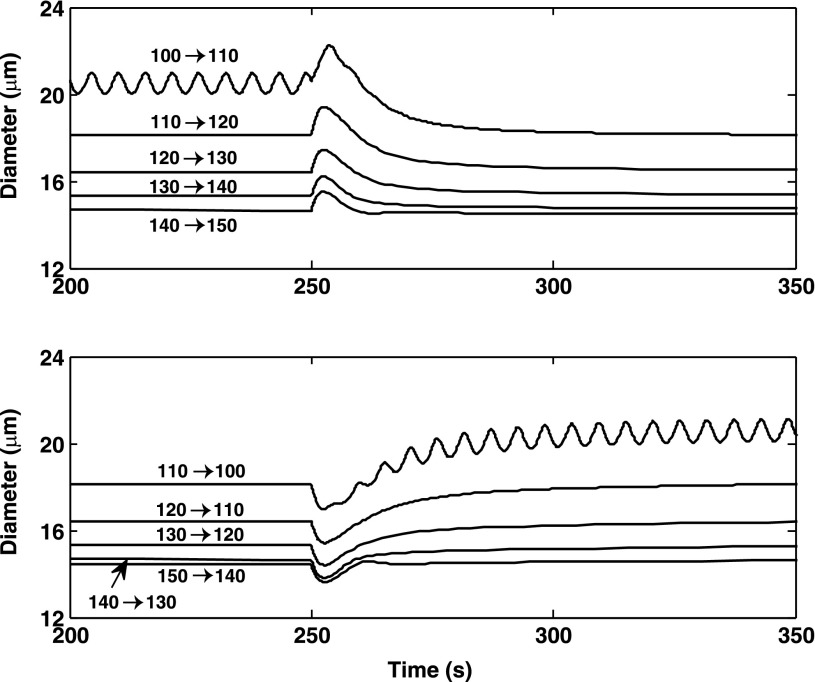
We then investigated the model AA response to smaller pressure steps. As shown in Fig. 14, a 10-mmHg pressure up- or down-step consistently elicits an autoregulatory response in the range we examined (100–150 mmHg). Compared with the previous simulations where pressure is varied from 80 to 160 mmHg, and vice versa, the 10-mmHg pressure steps result in smaller diameter changes. Interestingly, the response times induced by 10 mmHg pressure are then predicted to be longer: that for vasoconstriction is ∼30 s and that for vasodilation on the order of 70 s. As shown above, the response time is significantly augmented when the rate of Ca2+ entry into the cell is reduced. Our model assumes that the influx of Ca2+ via pressure-activated channels is proportional to the magnitude of the pressure variation; thus, the lower the pressure increase, the longer the response time. To further illustrate this, we computed time constants for different pressure up-steps, by fitting an exponential function to the contractile response. As the pressure was raised by 50, 40, 30, 20, and 10 mmHg (starting from 110 mmHg, to eliminate LCO), the time constant was determined as 4.5, 5.2, 6.1, 7.2, and 8.9 s, respectively. Together these results suggest that when the pressure step is decreased, the competing effects of slower Ca2+ entry and smaller diameter change result in longer overall response times.
Fig. 14.
Predicted vessel diameter profile following a 10 mmHg pressure up-step (top) or down-step (bottom). The numbers next to each curve indicate the pre- and poststep pressure values.
DISCUSSION
Comparison with previous modeling studies.
Early models of vascular smooth muscle focused on specific aspects of vascular function, e.g., membrane electrophysiology (32), cytosolic calcium regulation (50), myosin phosphorylation (19, 20), and muscle mechanics (16). A recent model of the AA smooth muscle cell that predicts spontaneous vasomotion and myogenic response is that of Chen et al. (5). That model incorporates Ca2+ and K+ transport, variations in the transmembrane potential, contraction of the AA smooth muscle cell, and the mechanics of a thick-walled cylinder. However, it does not differentiate between cytosolic and SR Ca2+ concentrations, and its representation of Ca2+ dynamics is much simpler than that of the present study.
As reviewed by Aalkjaer and Nilsson (1), vasomotion involves two types of oscillators, a cytosolic oscillator and a membrane oscillator, both of which are included in the present model. The SR Ca2+ pumps and receptors form a cytosolic oscillator: the alternation between Ca2+ uptake into, and release from, the SR gives rise to [Ca2+]cyt oscillations. The membrane oscillator is constituted of Ca2+- and voltage-dependent channels: hyperpolarizing channels, such as Ca2+-activated K+ channels, counteract voltage-dependent Ca2+ entry, thereby generating membrane potential oscillations (42). Intracellular Ca2+ acts as the coupling agent between the cytosolic and membrane oscillators, whose interaction is thought to be responsible for synchronization among adjacent vascular smooth muscle cells (VSMC), since the latter are electrically coupled.
Models of arterial smooth muscle cells that take into account spatial variations along the cytosol suggest that SR-induced calcium uptake and release can generate intracellular calcium waves that do not necessarily give rise to whole cell oscillations. The shift from waves to global oscillations requires activation of a transmembrane Ca2+-dependent channel that in turn affects the membrane potential (25). Our current model does not consider intracellular spatial variations; yet, in accordance with this proposed mechanism, it predicts that vasomotion disappears when one of the key components of the membrane oscillator (i.e., KCa, ClCa, or L-type channels) is inhibited.
The model in Ref. 5 elicited a myogenic response by assuming a pressure-induced shift in the voltage dependence of the open probability of Ca2+ channels. A follow-up study (44) posited instead that variations in the hydrostatic pressure induce changes in the activity of nonselective cation channels, an assumption that is more consistent with the experimental observation that the transmembrane potential itself is pressure-sensitive. However, the representation of a faster pressure-induced constriction (relative to dilation) remained ad hoc in both studies. For instance, the model in Ref. 44 assumed that pressure increases induce a transient overshoot in the cation current before returning to the target value. A principal motivation of this study was to understand the origin of response time asymmetry (discussed below).
Mechanisms underlying myogenic contraction.
Our results suggest that the following cascade of events underlies the myogenic response in the AA: following an increase in luminal pressure, the influx of cations via pressure-activated channels depolarizes the membrane, thereby activating voltage-gated Ca2+ channels; this in turn generates a large inflow of Ca2+. The subsequent activation of KCa channels acts to partially repolarize the membrane. These predictions are in good agreement with the body of experimental data reviewed by Davis and Hill (7). Together, these experimental studies indicate that voltage-gated Ca2+ channels play an essential role in the myogenic response and that K+ currents counteract myogenic tone. In our model, pressure-induced inhibition of Ca2+-activated K+ channels is not necessary to elicit contractile myogenic responses, but it slightly augments them. This has also been observed in cerebral arteries, where inhibition of large-conductance KCa channels enhances myogenic tone (2).
Given the poor specificity of chloride channel blockers, the role of these channels in the myogenic response remains to be fully understood. Studies in pressurized rat cerebral arteries have shown that some Cl− channel blockers (such as DIDS and indanyloxyacetic acid) induce significant vasodilation, whereas another, niflumic acid, has no effect on vascular tone (9, 41). However, niflumic acid also modulates the activity of other ion channels, including that of KCa channels (33), making it difficult to interpret these results. In our model of the AA, blocking ClCa channels significantly reduces Cl− efflux, thereby hyperpolarizing the cell, reducing [Ca2+]cyt and dilating the vessel (Fig. 9). It is possible that our model overestimates the contribution of ClCa channels to the resting membrane potential. In the absence of specific data, we assumed that ClCa channels and NaCl cotransporters are the main Cl− efflux and influx pathways, respectively, which may be too simple an approximation.
Some, but not all, investigators have found that myogenic constriction is contingent upon the release of Ca2+ by SR stores. Our model predicts that depletion of intracellular calcium stores (i.e., full inhibition of SERCA) has a negligible effect on the myogenic response. Blocking Ca2+ release via IP3R and RyR alters the response dynamics but not the final vessel diameter (Fig. 10).
Pressure-activated channels.
The mechanisms by which intraluminal pressure changes are sensed by vascular smooth muscle cells remain poorly understood. Recent studies, reviewed in reference (23), suggest that interactions between VSMC and the extracellular matrix play an essential role in mechanotransduction. It is thought that, as a first step, pressure causes deformation of matrix proteins and induces conformational changes in their cell surface receptors, subsequently modulating the activity of specific transmembrane ion channels. Drummond and colleagues have shown that the epithelial sodium channel (ENaC) is implicated in mechanotransduction in vascular smooth muscle cells (10), including in mouse interlobar arteries (26). A recent study found that in rats ENaC is expressed in both cortical radial arteries and AAs and that its inhibition attenuates the myogenic response of the AA (18). Other investigators, however, failed to detect ENaC expression in the rat AA, nor did they observe any effects of ENaC inhibitors (49). As a simplification, we assumed in this study that pressure directly activates a channel that carries both Na+ and Ca2+. The Na+:Ca2+ conductance ratio of the channel was taken as 20:3, so as to obtain good agreement with a range of experimental data.
Our model also assumes that pressure-activated channels respond immediately to a change in pressure, without any delay. As a consequence, [Ca2+]cyt and the fraction of phosphorylated MLC are predicted to start varying immediately as well. The vessel diameter, however, does not begin to go in the expected direction until pressure-induced tension, which dominates at first, is counterbalanced by the tension generated within the vessel wall. The initial delay in our simulations is therefore predominantly governed by this competition between forces. If pressure-activated channels do in fact respond with a delay, there may be a lag before the fraction of the phosphorylated MLC begins to rise.
Response times to pressure variations.
In agreement with experimental findings (34, 35), our model predicts that the overall response time for vasoconstriction is much shorter than that for vasodilation. We used our model to investigate the origin of this asymmetry.
Our simulations suggest that this difference can be at least partly ascribed to L-type channel kinetics. The open probability of the channel is strongly dependent on Vm. As shown in Fig. 13, the membrane potential does not change in a symmetric manner during an 80-mmHg pressure increase and decrease. As a consequence, the variation in Ca2+ influx via L-type channels following an up-step is greater than that following a down-step. The rate of [Ca2+]cyt change is therefore faster in the first case, and the fraction of phosphorylated MLC varies more rapidly. Hence, the overall response time is significantly shorter following a pressure increase.
It should be noted that the response times predicted by our model (approximately 15 and 32 s for constriction and dilation, respectively) are 30–50% longer than measured values (35). The concentrations and kinetic rates associated with the formation of CaM, MLCK, and MLCP have not been measured explicitly in the AA, so we used instead parameter values from other cell types. In addition, the current-voltage relationships of L-type channels in the AA were recently determined (46), but lacking data on time constants, we used a kinetic scheme developed for cardiac myocytes. The properties of several other Ca2+ transporters were also estimated or fitted in the absence of measurements. Together, these approximations may explain, at least in part, why our estimates of response times are slightly higher than experimental values.
The asymmetry in vasoconstriction and vasodilation response times is an example of rate sensitivity, which has been observed in other vascular beds (17, 27). Spectral analysis of renal blood flow dynamics by Wang et al. (48) revealed a substantial rate-sensitivity component, so that autoregulatory responses to rapid arterial pressure changes become more vigorous. A functional consequence of the asymmetric myogenic response times and a sufficiently fast vasoconstrictive response is that baseline myogenic tone is strongly influenced by systolic pressure (34, 35). Thus the myogenic response serves not only to maintain an approximately constant renal blood flow, but it also protects the glomerulus from systolic pressure peaks. This behavior may be physiologically important because studies have identified strong correlations between systolic pressure and renal injury (22).
In summary, our model of Ca2+ signaling and mechanical behavior in AA smooth muscle cells predicts spontaneous vasomotion at physiological luminal pressures, and suggests that the membrane-potential dependence of L-type channels partly underlies the asymmetry in myogenic response times during vasoconstriction and vasodilation.
GRANTS
This research was supported by National Institute of Diabetes and Digestive and Kidney Diseases Grant DK-089066 (to A. T. Layton).
DISCLOSURES
No conflicts of interest, financial or otherwise, are declared by the author(s).
REFERENCES
- 1.Aalkjar C, Nilsson H. Vasomotion: cellular background for the oscillator and for the synchronization of smooth muscle cells. Br J Pharmacol 144: 605–606, 2005 [DOI] [PMC free article] [PubMed] [Google Scholar]
- 2.Brayden JE, Nelson MT. Regulation of arterial tone by activation of calcium dependent potassium channels. Science 256: 532–535, 1992 [DOI] [PubMed] [Google Scholar]
- 3.Carlson BE, Arciero JC, Secomb TW. Theoretical model of blood flow autoregulation: roles of myogenic, shear-dependent, and metabolic responses. Am J Physiol Heart Circ Physiol 295: H1572–H1579, 2008 [DOI] [PMC free article] [PubMed] [Google Scholar]
- 4.Cavarape A, Endlich N, Assaloni R, Bartoli E, Steinhausen M, Parekh N, Endlich K. Rho-kinase inhibition blunts renal vasoconstriction induced by distinct signaling pathways in vivo. J Am Soc Nephrol 14: 37–45, 2003 [DOI] [PubMed] [Google Scholar]
- 5.Chen J, Sgouralis I, Moore LC, Layton HE, Layton AT. A mathematical model of the myogenic response to systolic pressure in the afferent arteriole. Am J Physiol Renal Physiol 300: F669–F681, 2011 [DOI] [PMC free article] [PubMed] [Google Scholar]
- 6.Cupples WA, Novak P, Novak V, Salevsky FC. Spontaneous blood pressure fluctuations and renal blood flow dynamics. Am J Physiol Renal Fluid Electrolyte Physiol 270: F82–F89, 1996 [DOI] [PubMed] [Google Scholar]
- 7.Davis MJ, Hill MA. Signaling mechanisms underlying the vascular myogenic response. Physiol Rev 79: 387–423, 1999 [DOI] [PubMed] [Google Scholar]
- 8.De Young G, Keizer J. A single-pool inositol 1,4,5-trisphosphate-receptor-based model for agonist-stimulated oscillations in Ca2+ concentrations. Proc Natl Acad Sci USA 89: 9895–9899, 1992 [DOI] [PMC free article] [PubMed] [Google Scholar]
- 9.Doughty JM, Miller AL, Langton PD. Non-specificity of chloride channel blockers in rat cerebral arteries: block of the L-type calcium channel. J Physiol 507: 433–439, 1998 [DOI] [PMC free article] [PubMed] [Google Scholar]
- 10.Drummond HA, Grifoni SC, Jernigan NL. A new trick for an old dogma: ENaC proteins as mechanotransducers in vascular smooth muscle. Physiology (Bethesda) 23: 23–31, 2008 [DOI] [PubMed] [Google Scholar]
- 11.Faber GM, Silva G, Livshitz L, Rudy Y. Kinetic properties of the cardiac L-type Ca2+ channel and its role in myocyte electrophysiology: a theoretical investigation. Biophys J 92: 1522–1543, 2007 [DOI] [PMC free article] [PubMed] [Google Scholar]
- 12.Fajmut A, Jagodic M, Brumen M. Mathematical modeling of the myosin light chain kinase activation. Chem Inf Model 45: 1605–1609, 2005 [DOI] [PubMed] [Google Scholar]
- 13.Feng MG, Navar LG. Angiotensin II-mediated constriction of afferent and efferent arterioles involves T-type Ca2+ channel activation. Am J Nephrol 24: 614–648, 2004 [DOI] [PubMed] [Google Scholar]
- 14.Flynn ER, Bradley KN, Muir TC, McCarron JG. Functionally separate intracellular Ca2+ stores in smooth muscle. J Biol Chem 276: 36411–36418, 2001 [DOI] [PubMed] [Google Scholar]
- 15.Furukawa KI, Nakamura H. Characterization of the (Ca2+-Mg2+)ATPase purified by calmodulin-affinity chromatography form bovine aortic smooth muscle. J Biochem 96: 1343–1350, 1984 [DOI] [PubMed] [Google Scholar]
- 16.Gestrelius S, Borgström A. A dynamic model of smooth muscle contraction. Biophys J 50: 157–169, 1986 [DOI] [PMC free article] [PubMed] [Google Scholar]
- 17.Grande PO, Lundvall J, Mellander S. Evidence for a rate-sensitive regulatory mechanism in myogenic microvascular control. Acta Physiol Scand 99: 432–447, 1977 [DOI] [PubMed] [Google Scholar]
- 18.Guan Z, Pollock JS, Cook AK, Hobbs JL, Inscho EW. Effect of epithelial sodium channel blockade on the myogenic response of rat juxtamedullary afferent arterioles. Hypertension 54: 1062–1069, 2009 [DOI] [PMC free article] [PubMed] [Google Scholar]
- 19.Hai C, Murphy RA. Cross-bridge phosphorylation and regulation of latch state in smooth muscle. Am J Physiol Cell Physiol 254: C99–C106, 1988 [DOI] [PubMed] [Google Scholar]
- 20.Hai C, Murphy RA. Regulation of shorting velocity by crossbridge phosphorylation in smooth muscle. Am J Physiol Cell Physiol 255: C86–C94, 1988 [DOI] [PubMed] [Google Scholar]
- 21.Hansen PB, Jensen BL, Andreasen D, Skott O. Differential expression of T- and L-type voltage-dependent calcium channels in renal resistance vessels. Circ Res 89: 630–638, 2001 [DOI] [PubMed] [Google Scholar]
- 22.He J, Whelton PK. Elevated systolic blood pressure and risk of cardiovascular and renal disease: overview of evidence from observational epidemiologic studies and randomized controlled trials. Am Heart J 138: 211–219, 1999 [DOI] [PubMed] [Google Scholar]
- 23.Hill MA, Meininger GA. Arteriolar vascular smooth muscle cells: mechanotransducers in a complex environment. Int J Biochem Cell Biol 44: 1505–1510, 2012 [DOI] [PMC free article] [PubMed] [Google Scholar]
- 24.Inscho EW, Cook AK, Webb RC, Jin LM. Rho-kinase inhibition reduces pressure mediated autoregulatory adjustments in afferent arteriolar diameter. Am J Physiol Renal Physiol 296: F590–F597, 2009 [DOI] [PMC free article] [PubMed] [Google Scholar]
- 25.Jacobsen JCB, Aalkjar C, Matchkov Nilsson VVH, Freiberg J, Holstein-Rathlou N.-H. Activation of a cGMP-sensitive calcium-dependent chloride channel may cause transition from calcium waves to whole cell oscillations in smooth muscle cells. Am J Physiol Heart Circ Physiol 293: H215–H228, 2007 [DOI] [PubMed] [Google Scholar]
- 26.Jernigan NL, Drummond HA. Vascular ENaC proteins are required for renal myogenic constriction. Am J Physiol Renal Physiol 289: F891–F901, 2005 [DOI] [PubMed] [Google Scholar]
- 27.Johansson B, Mellander S. Static and dynamic components in the vascular myogenic response to passive changes in length as revealed by electrical and mechanical recordings from the rat portal vein. Circ Res 36: 76–83, 1975 [DOI] [PubMed] [Google Scholar]
- 28.Johnson PC. The myogenic response. In: Handbook of Physiology. The Cardiovascular System. Vascular Smooth Muscle. Bethesda, MD: Am Physiol Soc, 1981, sect 2, vol 2, p. 409–442 [Google Scholar]
- 29.Kaneko-Kawano T, Takasu F, Naoki H, Sakumura Y, Ishii S, Ueba T, Eiyama A, Okada A, Kawano Y, Suzuki K. Dynamic regulation of myosin light chain phosphorylation by Rho-kinase. PLoS One 7: e39269, 2012 [DOI] [PMC free article] [PubMed] [Google Scholar]
- 30.Keizer J, Levine L. Ryanodine receptor adaptation and Ca2+-induced Ca2+ release dependent Ca2+ oscillations. Biophys J 71: 3477–3487, 1996 [DOI] [PMC free article] [PubMed] [Google Scholar]
- 31.Kneller J, Ramirez RJ, Chartier D, Courtemanche M, Nattel S. Time-dependent transients in an ionically based mathematical model of the canine atrial action potential. Am J Physiol Heart Circ Physiol 282: H1437–H1451, 2002 [DOI] [PubMed] [Google Scholar]
- 32.Lang RJ, Rattray-Wood CA. A simple mathematical model of the spontaneous electrical activity in a single smooth muscle myocyte. In: Smooth Muscle Excitation, edited by TB Bolton, T Tomita. New York: Academic, 1996, p. 391–402 [Google Scholar]
- 33.Ledoux J, Greenwood IA, Leblanc N. Dynamics of Ca2+-dependent Cl− channel modulation by niflumic acid in rabbit coronary arterial myocytes. Mol Pharmacol 67: 163–173, 2005 [DOI] [PubMed] [Google Scholar]
- 34.Loutzenhiser R, Bidani A, Chilton L. Renal myogenic response: kinetic attributes and physiologic role. Circ Res 90: 1316–1324, 2002 [DOI] [PubMed] [Google Scholar]
- 35.Loutzenhiser R, Bidani A, Wang X. Systolic pressure and the myogenic response of the renal afferent arteriole. Acta Physiol Scand 181: 404–413, 2004 [DOI] [PubMed] [Google Scholar]
- 36.Loutzenhiser R, Chilton L, Trottier G. Membrane potential measurements in renal afferent and efferent arterioles: actions of angiotensin II. Am J Physiol Renal Physiol 273: F307–F314, 1997 [DOI] [PubMed] [Google Scholar]
- 37.Luo CH, Rudy Y. A dynamic model of the cardiac ventricular action potential. I. Simulations of ionic currents and concentration changes. Circ Res 74: 1071–1096, 1994 [DOI] [PubMed] [Google Scholar]
- 38.Mbikou P, Fajmut A, Brumen M, Roux E. Contribution of Rho kinase to the early phase of the calcium-contraction coupling in airway smooth muscle. Exp Physiol 96: 240–258, 2011 [DOI] [PubMed] [Google Scholar]
- 39.Meininger GA, Davis MJ. Cellular mechanisms involved in the vascular myogenic response. Am J Physiol Heart Circ Physiol 263: H647–H659, 1992 [DOI] [PubMed] [Google Scholar]
- 40.Nakamura A, Hayashi K, Ozawa Y, Fujiwara K, Okubo K, Kanda T, Wakino S, Saruta T. Vessel- and vasoconstrictor-dependent role of Rho/Rho-kinase in renal microvascular tone. J Vasc Res 40: 244–251, 2003 [DOI] [PubMed] [Google Scholar]
- 41.Nelson MT, Conway MA, Knot HJ, Brayden JE. Chloride channel blockers inhibit myogenic tone in rat cerebral arteries. J Physiol 502: 259–264, 1997 [DOI] [PMC free article] [PubMed] [Google Scholar]
- 42.Parthimos D, Edwards DH, Griffith TM. Minimal model of arterial chaos generated by coupled intracellular and membrane Ca2+ oscillators. Am J Physiol Heart Circ Physiol 277: H1119–H1144, 1999 [DOI] [PubMed] [Google Scholar]
- 43.Perez-Reyes E. Molecular physiology of low-voltage-activated T-type calcium channels. Physiol Rev 83: 117–161, 2003 [DOI] [PubMed] [Google Scholar]
- 44.Sgouralis I, Layton AT. Autoregulation and conduction of vasomotor responses in a mathematical model of the rat afferent arteriole. Am J Physiol Renal Physiol 303: F229–F239, 2012 [DOI] [PMC free article] [PubMed] [Google Scholar]
- 45.Shannon TR, Wang F, Puglisi J, Weber C, Bers DM. A mathematical treatment of integrated Ca dynamics within the ventricular myocyte. Biophys J 87: 3351–3371, 2004 [DOI] [PMC free article] [PubMed] [Google Scholar]
- 46.Smirnov SV, Loutzenhiser K, Loutzenhiser R. Voltage-activated ca2+ channels in rat renal afferent and efferent myocytes: no evidence for the T-type Ca2+ current. Cardiovasc Res 97: 293–301, 2013 [DOI] [PubMed] [Google Scholar]
- 47.Takenaka T, Suzuki H, Okada H, Hayashi K, Kanno Y, Saruta T. Mechanosensitive cation channels mediate afferent arteriolar myogenic constriction in the isolated rat kidney. J Physiol 511: 245–253, 1998 [DOI] [PMC free article] [PubMed] [Google Scholar]
- 48.Wang X, Salevsky FC, Cupples WA. Nitric oxide, atrial natriuretic factor, and dynamic renal autoregulation. Can J Physiol Pharmacol 77: 777–786, 1999 [PubMed] [Google Scholar]
- 49.Wang X, Takeya K, Aaronson PI, Loutzenhiser K, Loutzenhiser R. Effects of amiloride, benzamil, and alterations in extracellular Na+ on the rat afferent arteriole and its myogenic response. Am J Physiol Renal Physiol 295: F272–F282, 2008 [DOI] [PMC free article] [PubMed] [Google Scholar]
- 50.Wong AY, Klassen GA. A model of calcium regulation in smooth muscle cell. Cell Calcium 14: 227–243, 1993 [DOI] [PubMed] [Google Scholar]
- 51.Wu BN, Brayden KD, Luykenaar JE, Giles WR, Wiehler Corteling WBRL, Welsh DG. Hyposmotic challenge inhibits inward rectifying K+ channels in cerebral arterial smooth muscle cells. Am J Physiol Heart Circ Physiol 292: H1085–H1094, 2007 [DOI] [PubMed] [Google Scholar]
- 52.Yang J, Clark JW, Jr, Bryan RM, Robertson C. The myogenic response in isolated rat cerebrovascular arteries: smooth muscle cell model. Med Eng Phys 25: 691–709, 2003 [DOI] [PubMed] [Google Scholar]
- 53.Zahler R, Zhang ZT, Manor M, Boron WF. Sodium kinetics of Na,K-ATPase alpha isoforms in intact transfected HeLa cells. J Gen Physiol 110: 201–213, 1997 [DOI] [PMC free article] [PubMed] [Google Scholar]


