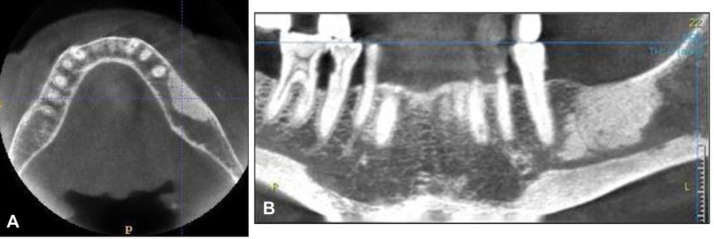
Figure 3.
A = Axial images of the mandible obtained with CBCT unit showing thickening of cortical plate and focal region of medullary bone density on the left body of mandible, the overlying mucosa is clinically intact.
B = Two-dimensional multiplanar reconstruction image showing the vertical dimension of the region of osteosclerosis and the relationship with mandibular canal.

