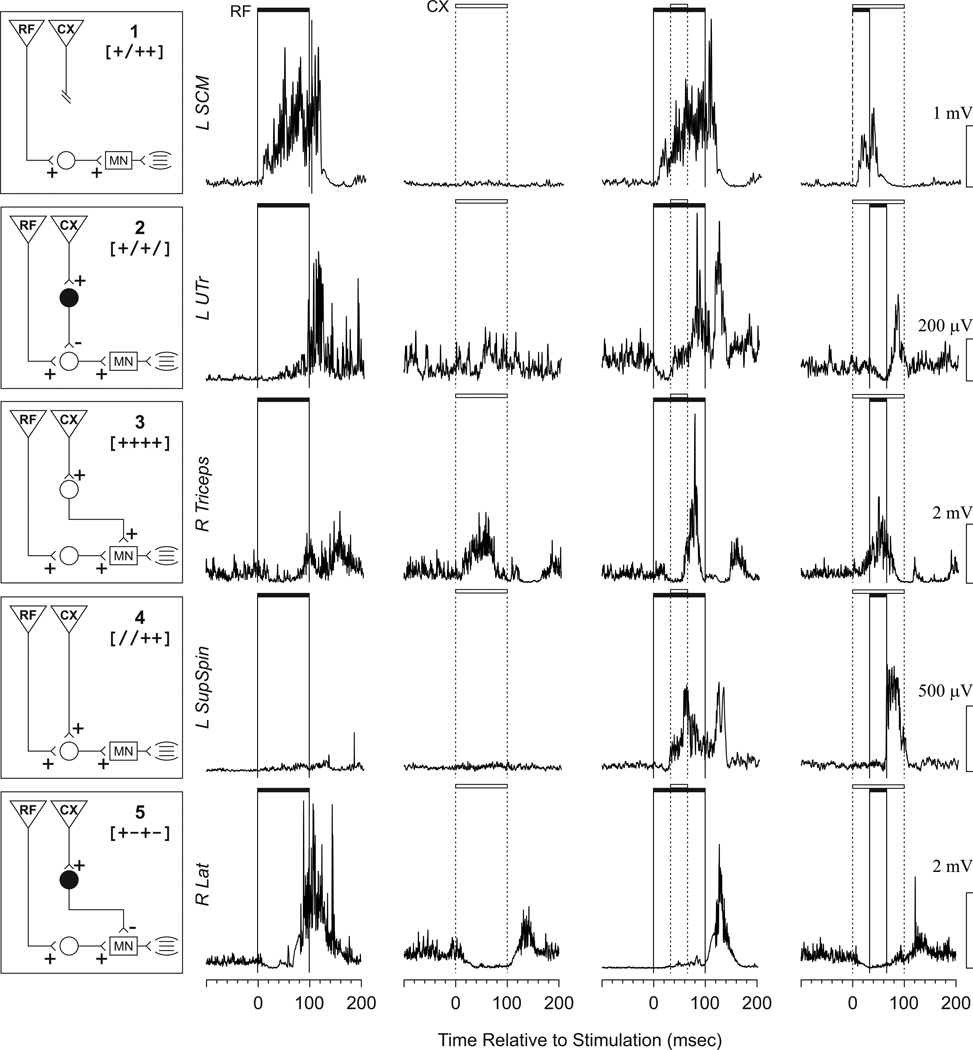
Figure 3.
Diagrams displaying the neural circuits used to explain the observed patterns, along with examples of a pattern for each. In the boxes on the left, inverted triangles represent projections from the descending systems (RF and CX), while circles represent interneurons (white excitatory, black inhibitory). The rectangles represent motoneuron pools in the spinal cord. An example of a set of EMG responses that would fit each of the theoretical neural circuits is shown in each row to the right of each circuit. The first column of EMG shows the response to reticular formation stimulation only (RF). The second column shows the response to cortical stimulation only (CX). The third and fourth columns represent joint stimulation. The filled horizontal bar indicates the duration of RF stimulation, and the open bar indicates CX stimulation. Scales for each EMG are shown to the right. The names of the muscles used as the examples are shown to the left. Further explanation of the circuits is provided in the discussion.

