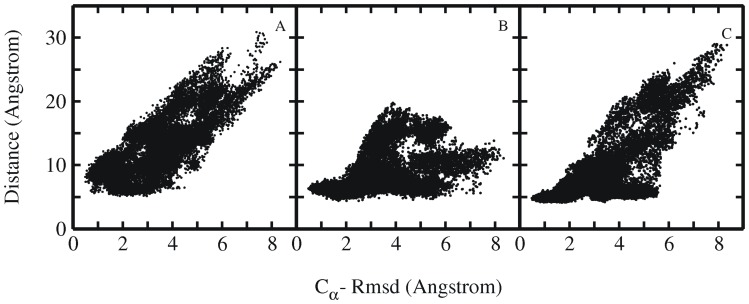
Figure 7. Rmsd and residue pair distance distribution.
Distribution plots showing the correlation between RMSDCα and distance between the residue pairs (A) Tyr3-Pro19, (B) Trp6-Pro12 and (C) Trp6-Pro18. Each point represents one sampled state in all simulations starting from intermediate Trp-cage structures.

