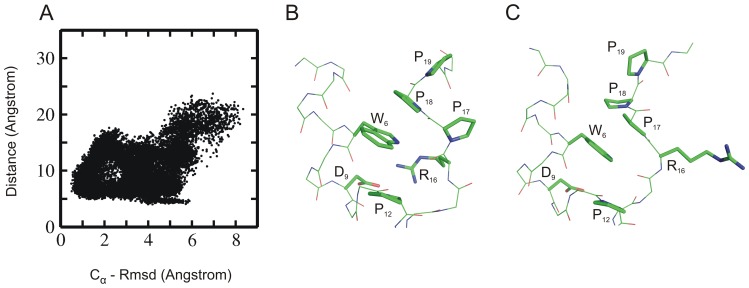
Figure 10. Rmsd and salt bridge distribution.
(A) Distribution plot showing the correlation between RMSDCα (from native structure) and the salt-bridge distance between residues Asp9– Arg16 of sampled Trp-cage conformations (starting from intermediate states simulated using Amber 03 force field). (B) Example snapshot with a small near native salt bridge distance (side chains of residues near Trp6 are shown as sticks with labels, backbone as thin sticks). In this conformation the Pro18 stacks on the side chain of Trp6. (C) Example of a near-native sampled state with large Asp9-Arg16 distance and non-native stacking of Pro17 (instead of Pro18) onto the Trp6 side chain.

